

An improved short-lived fluorescent protein transcriptional reporter for Saccharomyces cerevisiae
- PMID: 23172645
- PMCID: PMC3521066
- DOI: 10.1002/yea.2932
An improved short-lived fluorescent protein transcriptional reporter for Saccharomyces cerevisiae
Abstract
Ideal reporter genes for temporal transcription programmes have short half-lives that restrict their detection to the window in which their transcripts are present and translated. In an effort to meet this criterion for reporters of transcription in individual living cells, we adapted the ubiquitin fusion strategy for programmable N-end rule degradation to generate an N-degron version of green fluorescent protein (GFP) with a half-life of ~7 min. The GFP variant we used here (designated GFP*) has excellent fluorescence brightness and maturation properties, which make the destabilized reporter well suited for tracking the induction and attenuation kinetics of gene expression in living cells. These attributes are illustrated by its ability to track galactose- and pheromone-induced transcription in S. cerevisiae. We further show that the fluorescence measurements using the short-lived N-degron GFP* reporter gene accurately predict the transient mRNA profile of the prototypical pheromone-induced FUS1 gene.
Copyright © 2012 John Wiley & Sons, Ltd.
Figures
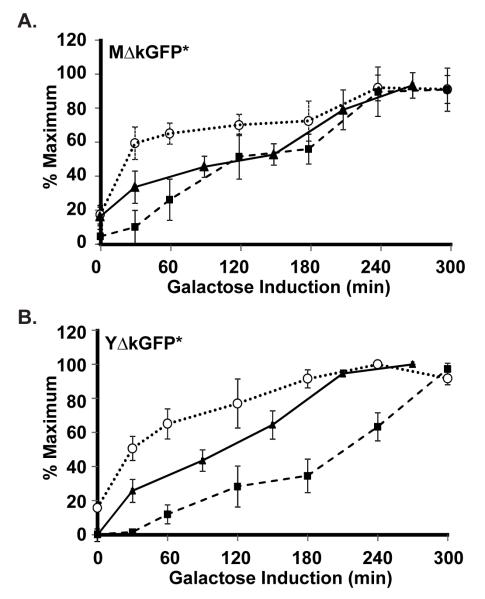
 ), protein (
 ), and fluorescence (
 ) in strains with the PGAL1-UBI-MΔkGFP* (C699-181) or PGAL1-UBI-YΔkGFP* (C699-183) reporters, as specified. The data points for mRNA and protein are the average values from four and three independent induction time courses, respectively. The data points for fluorescence are the average of the mean fluorescence from four independent induction time courses. (The mean fluorescence value at each time in given time course is determined from quantification of at least 25 cells.) Error bars show 95% confidence limits calculated from the independent time course determinations.
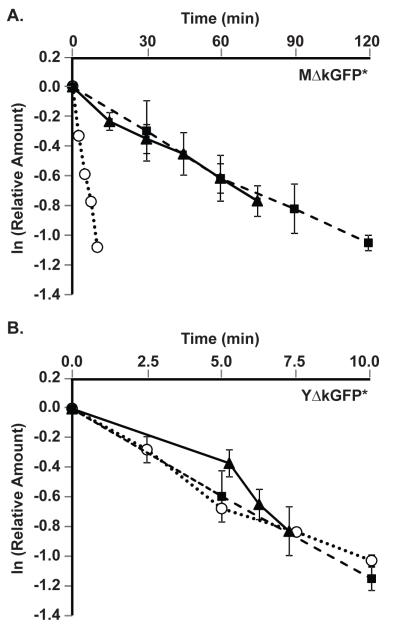
 ) and protein quantified by Western blot (
 ) or fluorescence (
 ) in strains with the GAL1-UBI-MΔkGFP* (C699-181) or GAL1-UBI-YΔkGFP* (C699-183) reporters, as specified. Amounts of each species are relative to steady state amounts before inhibition of transcription (t=0) by the addition of glucose to the cultures. Data points shown in each plot are the average of N independent experiments as specified in Table 3. Error bars show 95% confidence limits.
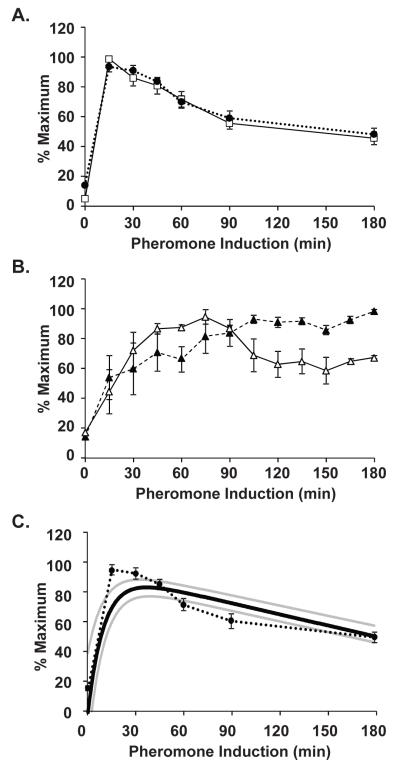
 ) and GFP* (
 ) mRNA in PFUS1-UBI-MΔkGFP* (C699-198) and PFUS1-UBI-YΔkGFP* (C699-199) strains. Data points are the average from six independent induction time courses (three with strain C699-198 and three with strain C699-199). Error bars show 95% confidence limits. (B) Plot comparing the pheromone induction profile for GFP* fluorescence in the PFUS1-UBI-MΔkGFP* (C699-198) (
 ) and PFUS1-UBI-YΔkGFP* (C699-199)
  reporter strains. More than 25 or 50 individual cells were scored for each time point in a single time course with strain C699-198 or C699-199, respectively. Each data point is the average from four independent time courses. Error bars show 95% confidence limits. (C) Model prediction of the pheromone induced FUS1 mRNA profile using YΔkGFP* fluorescence measurements as input. Plot compares the model mean (
 ) and range (min, max
  ) to the empirically determined reporter GFP* mRNA profile
  from (A).
Similar articles
-
A family of destabilized cyan fluorescent proteins as transcriptional reporters in S. cerevisiae.Yeast. 2006 Apr 15;23(5):333-49. doi: 10.1002/yea.1358. Yeast. 2006. PMID: 16598699
-
Green fluorescent protein in Saccharomyces cerevisiae: real-time studies of the GAL1 promoter.Biotechnol Bioeng. 2000 Oct 20;70(2):187-96. doi: 10.1002/1097-0290(20001020)70:2<187::aid-bit8>3.0.co;2-h. Biotechnol Bioeng. 2000. PMID: 10972930
-
Preparation of Saccharomyces cerevisiae expression plasmids.Methods Mol Biol. 2012;866:41-6. doi: 10.1007/978-1-61779-770-5_4. Methods Mol Biol. 2012. PMID: 22454112
-
3'-end formation signals modulate the association of genes with the nuclear periphery as well as mRNP dot formation.EMBO J. 2006 Sep 20;25(18):4253-62. doi: 10.1038/sj.emboj.7601305. Epub 2006 Aug 31. EMBO J. 2006. PMID: 16946703 Free PMC article.
-
The GFP thermal shift assay for screening ligand and lipid interactions to solute carrier transporters.Nat Protoc. 2021 Dec;16(12):5357-5376. doi: 10.1038/s41596-021-00619-w. Epub 2021 Oct 27. Nat Protoc. 2021. PMID: 34707255 Review.
Cited by
-
Real-time quantification of protein expression at the single-cell level via dynamic protein synthesis translocation reporters.Nat Commun. 2016 Apr 21;7:11304. doi: 10.1038/ncomms11304. Nat Commun. 2016. PMID: 27098003 Free PMC article.
-
A Cas9-based toolkit to program gene expression in Saccharomyces cerevisiae.Nucleic Acids Res. 2017 Jan 9;45(1):496-508. doi: 10.1093/nar/gkw1023. Epub 2016 Nov 28. Nucleic Acids Res. 2017. PMID: 27899650 Free PMC article.
-
Deciphering the cis-regulatory landscape of natural yeast Transcript Leaders.bioRxiv [Preprint]. 2024 Jul 5:2024.07.03.601937. doi: 10.1101/2024.07.03.601937. bioRxiv. 2024. Update in: Nucleic Acids Res. 2025 Feb 27;53(5):gkaf165. doi: 10.1093/nar/gkaf165. PMID: 39005336 Free PMC article. Updated. Preprint.
-
Proteaphagy is specifically regulated and requires factors dispensable for general autophagy.J Biol Chem. 2022 Jan;298(1):101494. doi: 10.1016/j.jbc.2021.101494. Epub 2021 Dec 14. J Biol Chem. 2022. PMID: 34919962 Free PMC article.
-
Rapid induction of GFP expression by the nitrate reductase promoter in the diatom Phaeodactylum tricornutum.PeerJ. 2016 Aug 25;4:e2344. doi: 10.7717/peerj.2344. eCollection 2016. PeerJ. 2016. PMID: 27635322 Free PMC article.
References
-
- Amberg DC, Burke DJ, Strathern JN. Methods in Yeast Genetics. Cold Spring Harbor Lab. Press: Cold Spring Harbor; New York: 2005.
-
- Bachmair A, Finley D, Varshavsky A. In vivo half-life of a protein is a function of its amino-terminal residue. Science. 1986;234:179–86. - PubMed
-
- Bachmair A, Varshavsky A. The degradation signal in a short-lived protein. Cell. 1989;56:1019–32. - PubMed
-
- Blake WJ, M KA, Cantor CR, Collins JJ. Noise in eukaryotic gene expression. Nature. 2003;422:633–7. - PubMed
Publication types
MeSH terms
Substances
Grants and funding
LinkOut - more resources
Full Text Sources
Other Literature Sources
Molecular Biology Databases
Research Materials