

Disease risk score as a confounder summary method: systematic review and recommendations
- PMID: 23172692
- PMCID: PMC3691557
- DOI: 10.1002/pds.3377
Disease risk score as a confounder summary method: systematic review and recommendations
Abstract
Purpose: To systematically examine trends and applications of the disease risk score (DRS) as a confounder summary method.
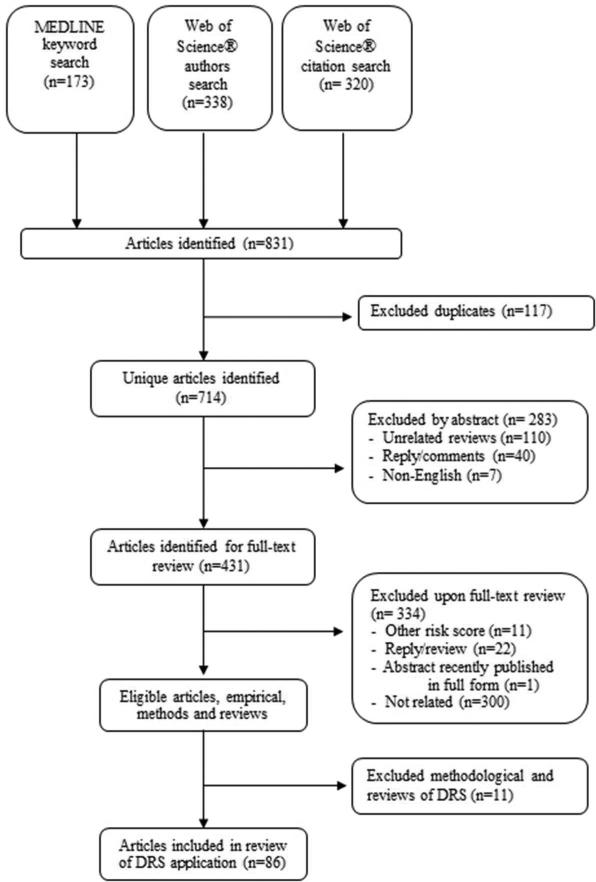
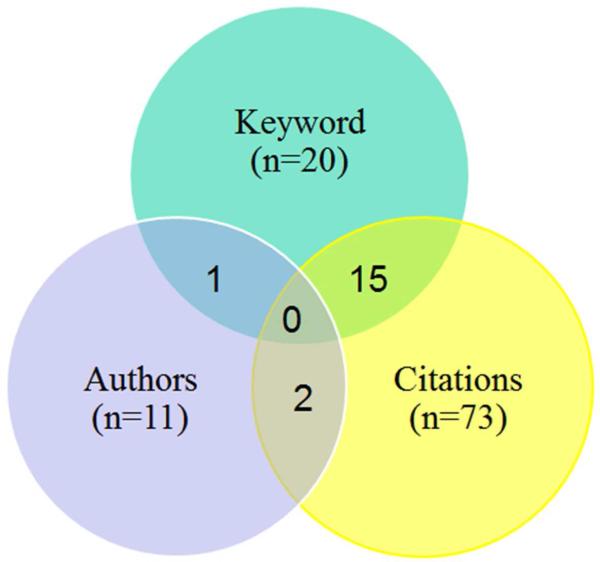
Methods: We completed a systematic search of MEDLINE and Web of Science® to identify all English language articles that applied DRS methods. We tabulated the number of publications by year and type (empirical application, methodological contribution, or review paper) and summarized methods used in empirical applications overall and by publication year (<2000, ≥2000).
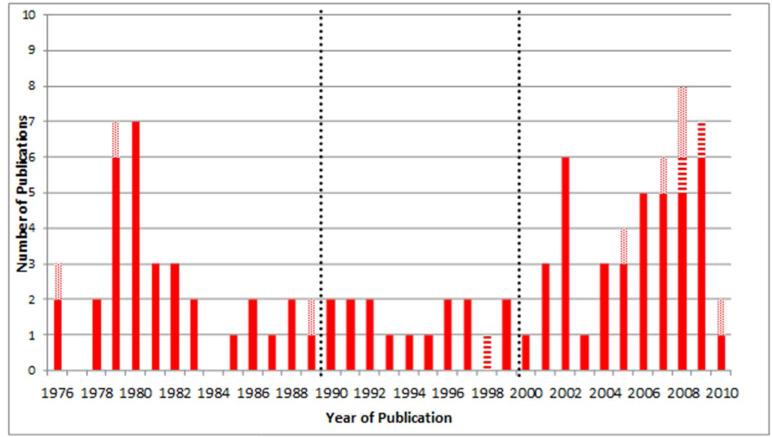
Results: Of 714 unique articles identified, 97 examined DRS methods and 86 were empirical applications. We observed a bimodal distribution in the number of publications over time, with a peak 1979-1980, and resurgence since 2000. The majority of applications with methodological detail derived DRS using logistic regression (47%), used DRS as a categorical variable in regression (93%), and applied DRS in a non-experimental cohort (47%) or case-control (42%) study. Few studies examined effect modification by outcome risk (23%).
Conclusion: Use of DRS methods has increased yet remains low. Comparative effectiveness research may benefit from more DRS applications, particularly to examine effect modification by outcome risk. Standardized terminology may facilitate identification, application, and comprehension of DRS methods. More research is needed to support the application of DRS methods, particularly in case-control studies.
Copyright © 2012 John Wiley & Sons, Ltd.
Figures
Similar articles
-
Interventions to increase attendance for diabetic retinopathy screening.Cochrane Database Syst Rev. 2018 Jan 15;1(1):CD012054. doi: 10.1002/14651858.CD012054.pub2. Cochrane Database Syst Rev. 2018. PMID: 29333660 Free PMC article.
-
Drugs for preventing postoperative nausea and vomiting in adults after general anaesthesia: a network meta-analysis.Cochrane Database Syst Rev. 2020 Oct 19;10(10):CD012859. doi: 10.1002/14651858.CD012859.pub2. Cochrane Database Syst Rev. 2020. PMID: 33075160 Free PMC article.
-
Interventions for palliative symptom control in COVID-19 patients.Cochrane Database Syst Rev. 2021 Aug 23;8(8):CD015061. doi: 10.1002/14651858.CD015061. Cochrane Database Syst Rev. 2021. PMID: 34425019 Free PMC article.
-
Signs and symptoms to determine if a patient presenting in primary care or hospital outpatient settings has COVID-19.Cochrane Database Syst Rev. 2022 May 20;5(5):CD013665. doi: 10.1002/14651858.CD013665.pub3. Cochrane Database Syst Rev. 2022. PMID: 35593186 Free PMC article.
-
Consolidated standards of reporting trials (CONSORT) and the completeness of reporting of randomised controlled trials (RCTs) published in medical journals.Cochrane Database Syst Rev. 2012 Nov 14;11(11):MR000030. doi: 10.1002/14651858.MR000030.pub2. Cochrane Database Syst Rev. 2012. PMID: 23152285 Free PMC article.
Cited by
-
Comparative Effectiveness and Safety of Direct Oral Anticoagulants: Overview of Systematic Reviews.Drug Saf. 2019 Dec;42(12):1409-1422. doi: 10.1007/s40264-019-00866-7. Drug Saf. 2019. PMID: 31552603
-
Optimal duration for continuation of statin therapy in bacteremic patients.Ther Adv Infect Dis. 2018 May 17;5(5):83-90. doi: 10.1177/2049936118775926. eCollection 2018 Sep. Ther Adv Infect Dis. 2018. PMID: 30224951 Free PMC article.
-
Racial and ethnic disparities in coronavirus disease 2019 disease incidence independent of comorbidities, among people with HIV in the United States.AIDS. 2022 Jul 1;36(8):1095-1103. doi: 10.1097/QAD.0000000000003223. Epub 2022 May 6. AIDS. 2022. PMID: 35796731 Free PMC article.
-
Racial and ethnic disparities in COVID-19 disease incidence independent of comorbidities, among people with HIV in the US.medRxiv [Preprint]. 2021 Dec 8:2021.12.07.21267296. doi: 10.1101/2021.12.07.21267296. medRxiv. 2021. Update in: AIDS. 2022 Jul 1;36(8):1095-1103. doi: 10.1097/QAD.0000000000003223. PMID: 34909782 Free PMC article. Updated. Preprint.
-
The "Dry-Run" Analysis: A Method for Evaluating Risk Scores for Confounding Control.Am J Epidemiol. 2017 May 1;185(9):842-852. doi: 10.1093/aje/kwx032. Am J Epidemiol. 2017. PMID: 28338910 Free PMC article.
References
-
- Rothman KJ, Greenland S, Lash TL. Modern Epidemiology. 3rd ed. Walters Kluwer Health/Lippincott Williams & Wilkins; Philadelphia: 2008.
-
- Rosenbaum PR, Rubin DB. The central role of the propensity score in observational studies for causal effects. Biometrika. 1983;70:41–55.
-
- Stürmer T, Joshi M, Glynn RJ, Avorn J, Rothman KJ, Schneeweiss S. A review of the application of propensity score methods yielded increasing use, advantages in specific settings, but not substantially different estimates compared with conventional multivariable methods. J Clin Epidemiol. 2006;59:437–47. - PMC - PubMed
-
- Miettinen OS. Stratification by a multivariate confounder score. Am J Epidemiol. 1976;104:609–20. - PubMed
Publication types
MeSH terms
Grants and funding
LinkOut - more resources
Full Text Sources
