

Venous and arterial flow quantification are equally accurate and precise with parallel imaging compressed sensing 4D phase contrast MRI
- PMID: 23172846
- PMCID: PMC3582745
- DOI: 10.1002/jmri.23936
Venous and arterial flow quantification are equally accurate and precise with parallel imaging compressed sensing 4D phase contrast MRI
Abstract
Purpose: To evaluate the precision and accuracy of parallel-imaging compressed-sensing 4D phase contrast (PICS-4DPC) magnetic resonance imaging (MRI) venous flow quantification in children with patients referred for cardiac MRI at our children's hospital.
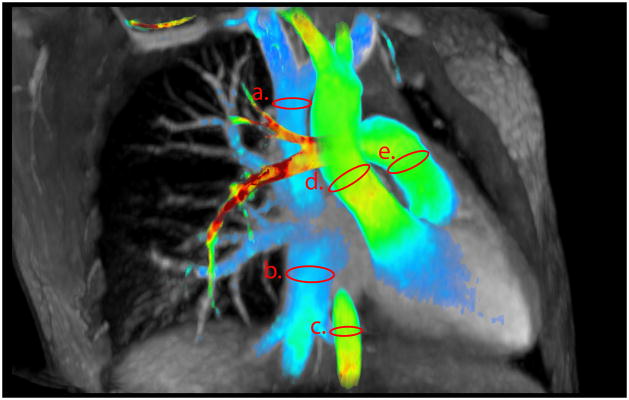
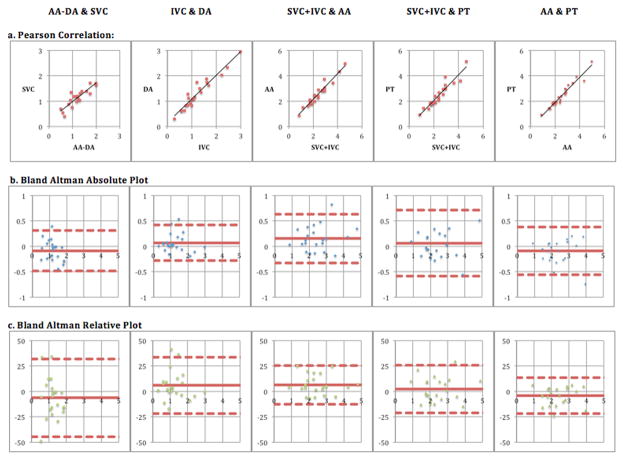
Materials and methods: With Institutional Review Board (IRB) approval and Health Insurance Portability and Accountability Act (HIPAA) compliance, 22 consecutive patients without shunts underwent 4DPC as part of clinical cardiac MRI examinations. Flow measurements were obtained in the superior and inferior vena cava, ascending and descending aorta, and the pulmonary trunk. Conservation of flow to the upper, lower, and whole body was used as an internal physiologic control. The arterial and venous flow rates at each location were compared with paired t-tests and F-tests to assess relative accuracy and precision.
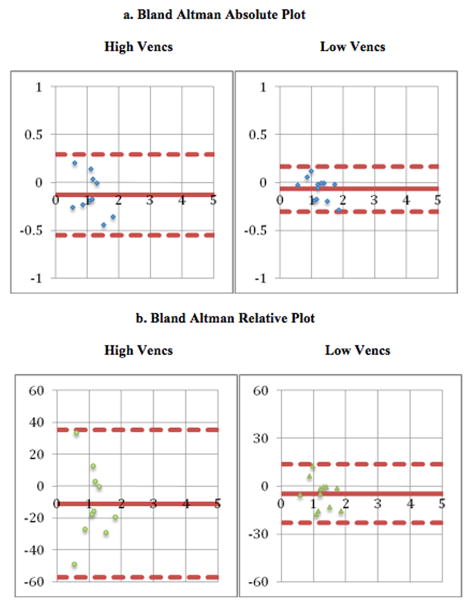
Results: Arterial and venous flow measurements were strongly correlated with the upper (ρ = 0.89), lower (ρ = 0.96), and whole body (ρ = 0.97); net aortic and pulmonary trunk flow rates were also tightly correlated (ρ = 0.97). There was no significant difference in the value or precision of arterial and venous flow measurements in upper, lower, or whole body, although there was a trend toward improved precision with lower velocity-encoding settings.
Conclusion: With PICS-4DPC MRI, the accuracy and precision of venous flow quantification are comparable to that of arterial flow quantification at velocity-encodings appropriate for arterial vessels.
Copyright © 2012 Wiley Periodicals, Inc.
Figures
Similar articles
-
Improved quantification and mapping of anomalous pulmonary venous flow with four-dimensional phase-contrast MRI and interactive streamline rendering.J Magn Reson Imaging. 2015 Dec;42(6):1765-76. doi: 10.1002/jmri.24928. Epub 2015 Apr 24. J Magn Reson Imaging. 2015. PMID: 25914149 Free PMC article.
-
Comprehensive motion-compensated highly accelerated 4D flow MRI with ferumoxytol enhancement for pediatric congenital heart disease.J Magn Reson Imaging. 2016 Jun;43(6):1355-68. doi: 10.1002/jmri.25106. Epub 2015 Dec 9. J Magn Reson Imaging. 2016. PMID: 26646061 Free PMC article.
-
Comprehensive Neonatal Cardiac, Feed and Wrap, Non-contrast, Non-sedated, Free-breathing Compressed Sensing 4D Flow MRI Assessment.J Magn Reson Imaging. 2023 Mar;57(3):789-799. doi: 10.1002/jmri.28325. Epub 2022 Jul 6. J Magn Reson Imaging. 2023. PMID: 35792484
-
4D flow MRI.J Magn Reson Imaging. 2012 Nov;36(5):1015-36. doi: 10.1002/jmri.23632. J Magn Reson Imaging. 2012. PMID: 23090914 Review.
-
Imaging of the thoracic aorta with time-resolved three-dimensional phase-contrast MRI: a review.Semin Thorac Cardiovasc Surg. 2008 Winter;20(4):358-64. doi: 10.1053/j.semtcvs.2008.11.013. Semin Thorac Cardiovasc Surg. 2008. PMID: 19251177 Review.
Cited by
-
4D flow MRI applications in congenital heart disease.Eur Radiol. 2021 Feb;31(2):1160-1174. doi: 10.1007/s00330-020-07210-z. Epub 2020 Sep 1. Eur Radiol. 2021. PMID: 32870392 Review.
-
Additional value and new insights by four-dimensional flow magnetic resonance imaging in congenital heart disease: application in neonates and young children.Pediatr Radiol. 2021 Jul;51(8):1503-1517. doi: 10.1007/s00247-020-04885-w. Epub 2020 Dec 11. Pediatr Radiol. 2021. PMID: 33313980 Free PMC article. Review.
-
4D flow cardiovascular magnetic resonance consensus statement.J Cardiovasc Magn Reson. 2015 Aug 10;17(1):72. doi: 10.1186/s12968-015-0174-5. J Cardiovasc Magn Reson. 2015. PMID: 26257141 Free PMC article. Review.
-
Four-dimensional flow cardiovascular magnetic resonance in tetralogy of Fallot: a systematic review.J Cardiovasc Magn Reson. 2021 May 20;23(1):59. doi: 10.1186/s12968-021-00745-0. J Cardiovasc Magn Reson. 2021. PMID: 34011372 Free PMC article.
-
Non-enhanced MRI flow evaluation using 4D versus 2D phase-contrast in repaired Tetralogy of Fallot adults.Eur Radiol. 2025 Oct;35(10):6313-6322. doi: 10.1007/s00330-025-11542-z. Epub 2025 Apr 17. Eur Radiol. 2025. PMID: 40244407
References
-
- Beerbaum P, Korperich H, Barth P, Esdorn H, Gieseke J, Meyer H. Noninvasive quantification of left-to-right shunt in pediatric patients: phase-contrast cine magnetic resonance imaging compared with invasive oximetry. Circulation. 2001;103:2476–2482. - PubMed
-
- Szolar DH, Sakuma H, Higgins CB. Cardiovascular applications of magnetic resonance flow and velocity measurements. J Magn Reson Imaging. 1996;6:78–89. - PubMed
-
- Higgins CB, Sakuma H. Heart disease: functional evaluation with MR imaging. Radiology. 1996;199:307–315. - PubMed
-
- Pelc NJ, Herfkens RJ, Shimakawa A, Enzmann DR. Phase contrast cine magnetic resonance imaging. Magn Reson Q. 1991;7:229–254. - PubMed
-
- Nordmeyer S, Riesenkampff E, Crelier G, et al. Flow-sensitive four-dimensional cine magnetic resonance imaging for offline blood flow quantification in multiple vessels: a validation study. J Magn Reson Imaging. 2010;32:677–683. - PubMed
Publication types
MeSH terms
Grants and funding
LinkOut - more resources
Full Text Sources
Other Literature Sources
