

Quantitative trait loci mapping of the mouse plasma proteome (pQTL)
- PMID: 23172855
- PMCID: PMC3567747
- DOI: 10.1534/genetics.112.143354
Quantitative trait loci mapping of the mouse plasma proteome (pQTL)
Abstract
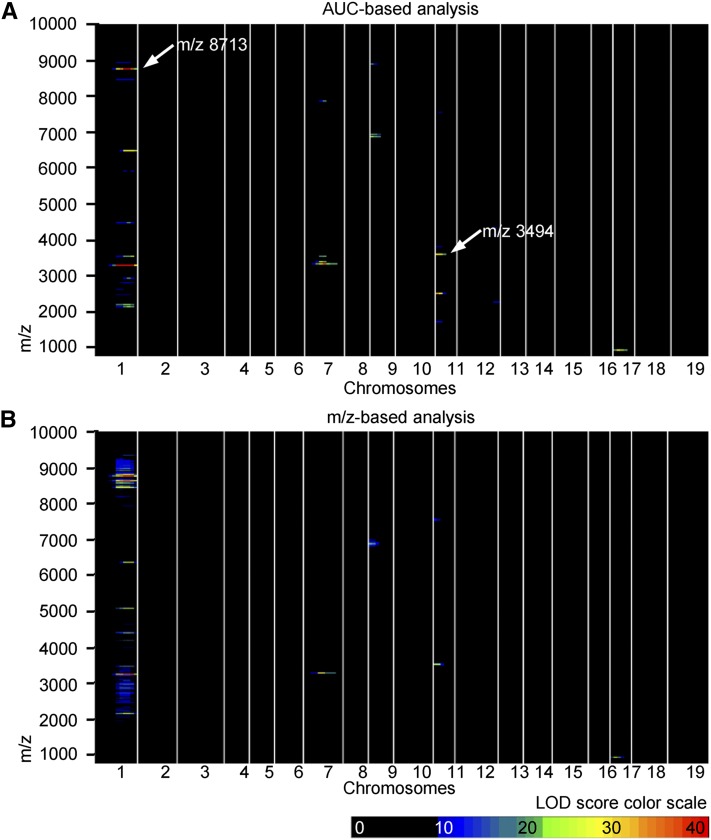
A current challenge in the era of genome-wide studies is to determine the responsible genes and mechanisms underlying newly identified loci. Screening of the plasma proteome by high-throughput mass spectrometry (MALDI-TOF MS) is considered a promising approach for identification of metabolic and disease processes. Therefore, plasma proteome screening might be particularly useful for identifying responsible genes when combined with analysis of variation in the genome. Here, we describe a proteomic quantitative trait locus (pQTL) study of plasma proteome screens in an F(2) intercross of 455 mice mapped with 177 genetic markers across the genome. A total of 69 of 176 peptides revealed significant LOD scores (≥5.35) demonstrating strong genetic regulation of distinct components of the plasma proteome. Analyses were confirmed by mechanistic studies and MALDI-TOF/TOF, liquid chromatography-tandem mass spectrometry (LC-MS/MS) analyses of the two strongest pQTLs: A pQTL for mass-to-charge ratio (m/z) 3494 (LOD 24.9, D11Mit151) was identified as the N-terminal 35 amino acids of hemoglobin subunit A (Hba) and caused by genetic variation in Hba. Another pQTL for m/z 8713 (LOD 36.4; D1Mit111) was caused by variation in apolipoprotein A2 (Apoa2) and cosegregated with HDL cholesterol. Taken together, we show that genome-wide plasma proteome profiling in combination with genome-wide genetic screening aids in the identification of causal genetic variants affecting abundance of plasma proteins.
Figures


Similar articles
-
Genetic control of the human brain proteome.Am J Hum Genet. 2021 Mar 4;108(3):400-410. doi: 10.1016/j.ajhg.2021.01.012. Epub 2021 Feb 10. Am J Hum Genet. 2021. PMID: 33571421 Free PMC article.
-
Identification of Common and Rare Genetic Variation Associated With Plasma Protein Levels Using Whole-Exome Sequencing and Mass Spectrometry.Circ Genom Precis Med. 2018 Dec;11(12):e002170. doi: 10.1161/CIRCGEN.118.002170. Circ Genom Precis Med. 2018. PMID: 30562114 Free PMC article.
-
Quantitative trait locus analysis of plasma cholesterol levels and body weight by controlling the effects of the Apoa2 allele in mice.J Vet Med Sci. 2007 Apr;69(4):385-92. doi: 10.1292/jvms.69.385. J Vet Med Sci. 2007. PMID: 17485926
-
The MALDI-TOF mass spectrometric view of the plasma proteome and peptidome.Clin Chem. 2006 Jul;52(7):1223-37. doi: 10.1373/clinchem.2006.069252. Epub 2006 Apr 27. Clin Chem. 2006. PMID: 16644871 Review.
-
Proteome research: complementarity and limitations with respect to the RNA and DNA worlds.Electrophoresis. 1997 Aug;18(8):1217-42. doi: 10.1002/elps.1150180804. Electrophoresis. 1997. PMID: 9298643 Review.
Cited by
-
The impact of genomic variation on protein phosphorylation states and regulatory networks.Mol Syst Biol. 2022 May;18(5):e10712. doi: 10.15252/msb.202110712. Mol Syst Biol. 2022. PMID: 35574625 Free PMC article.
-
Plasma protein levels of young healthy pigs as indicators of disease resilience.J Anim Sci. 2023 Jan 3;101:skad014. doi: 10.1093/jas/skad014. J Anim Sci. 2023. PMID: 36638126 Free PMC article.
-
Integrative Analysis of Multi-omics Data for Discovery and Functional Studies of Complex Human Diseases.Adv Genet. 2016;93:147-90. doi: 10.1016/bs.adgen.2015.11.004. Epub 2016 Jan 25. Adv Genet. 2016. PMID: 26915271 Free PMC article. Review.
-
The role of regulatory variation in complex traits and disease.Nat Rev Genet. 2015 Apr;16(4):197-212. doi: 10.1038/nrg3891. Epub 2015 Feb 24. Nat Rev Genet. 2015. PMID: 25707927 Review.
-
Multi-omic data integration and analysis using systems genomics approaches: methods and applications in animal production, health and welfare.Genet Sel Evol. 2016 Apr 29;48(1):38. doi: 10.1186/s12711-016-0217-x. Genet Sel Evol. 2016. PMID: 27130220 Free PMC article. Review.
References
-
- Anderson N. L., Anderson N. G., 2002. The human plasma proteome: history, character, and diagnostic prospects. Mol. Cell. Proteomics 1: 845–867 - PubMed
-
- Baumann S., Ceglarek U., Fiedler G. M., Lembcke J., Leichtle A., et al. , 2005. Standardized approach to proteome profiling of human serum based on magnetic bead separation and matrix-assisted laser desorption/ionization time-of-flight mass spectrometry. Clin. Chem. 51: 973–980 - PubMed
-
- Broman K. W., Wu H., Sen S., Churchill G. A., 2003. R/qtl: QTL mapping in experimental crosses. Bioinformatics 19: 889–890 - PubMed
-
- Crick F., 1970. Central dogma of molecular biology. Nature 227: 561–563 - PubMed
Publication types
MeSH terms
Substances
LinkOut - more resources
Full Text Sources
Molecular Biology Databases
Miscellaneous
