. 2013 Apr;62(4):1084-93.
doi: 10.2337/db12-1139. Epub 2012 Nov 19.

Flavonoid apigenin is an inhibitor of the NAD+ ase CD38: implications for cellular NAD+ metabolism, protein acetylation, and treatment of metabolic syndrome

Affiliations

Flavonoid apigenin is an inhibitor of the NAD+ ase CD38: implications for cellular NAD+ metabolism, protein acetylation, and treatment of metabolic syndrome

Carlos Escande et al. Diabetes. 2013 Apr.

Abstract

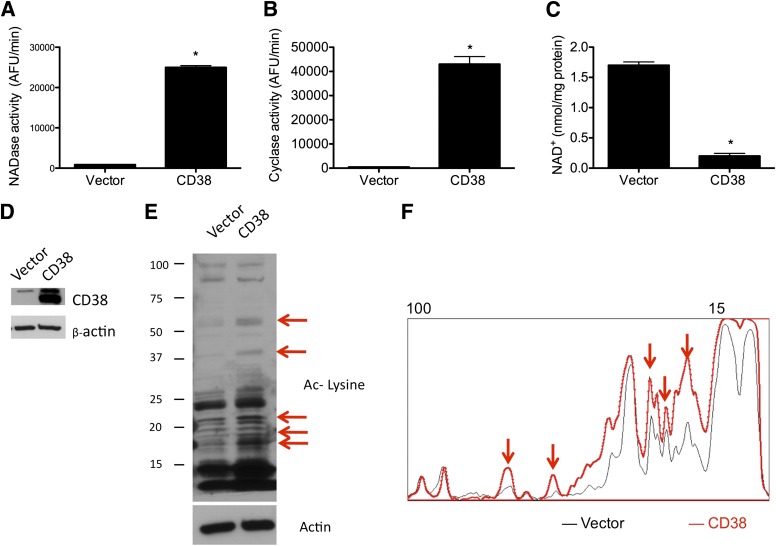
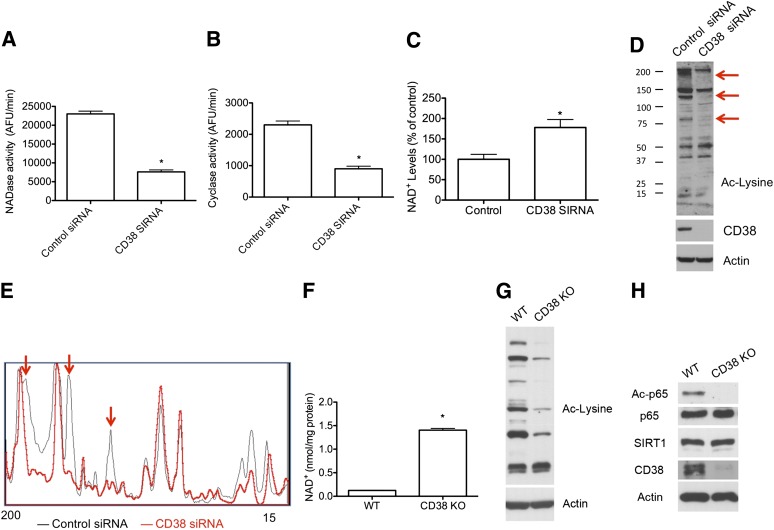
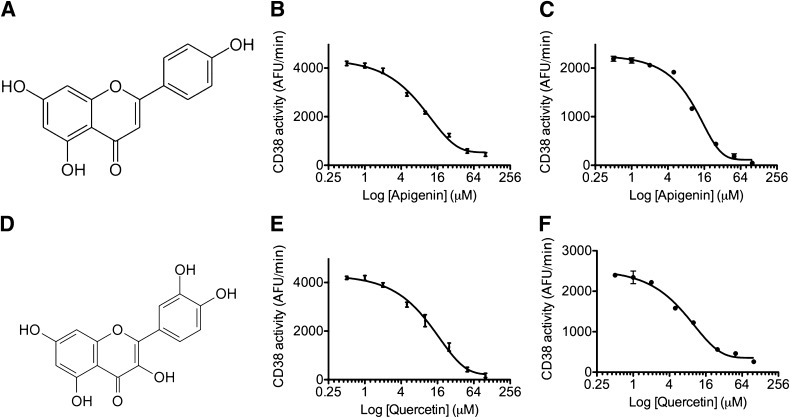
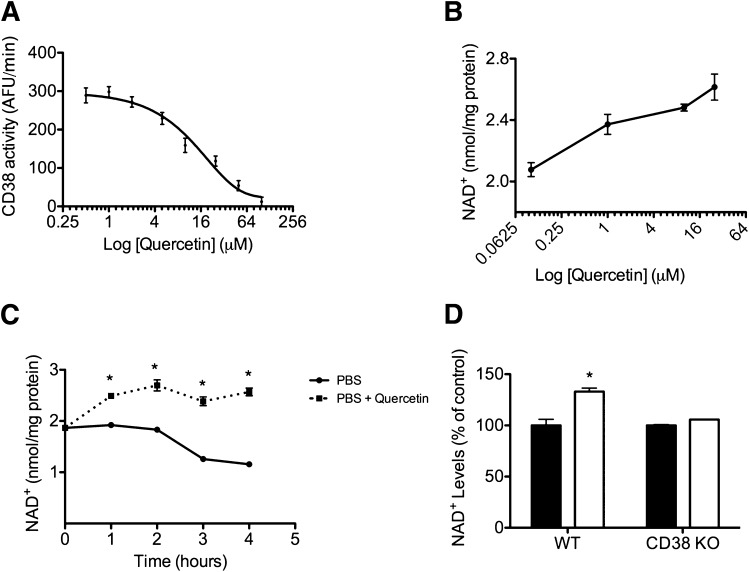
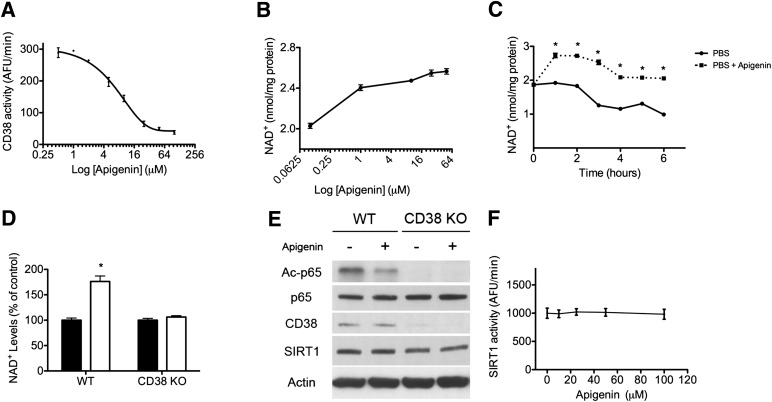
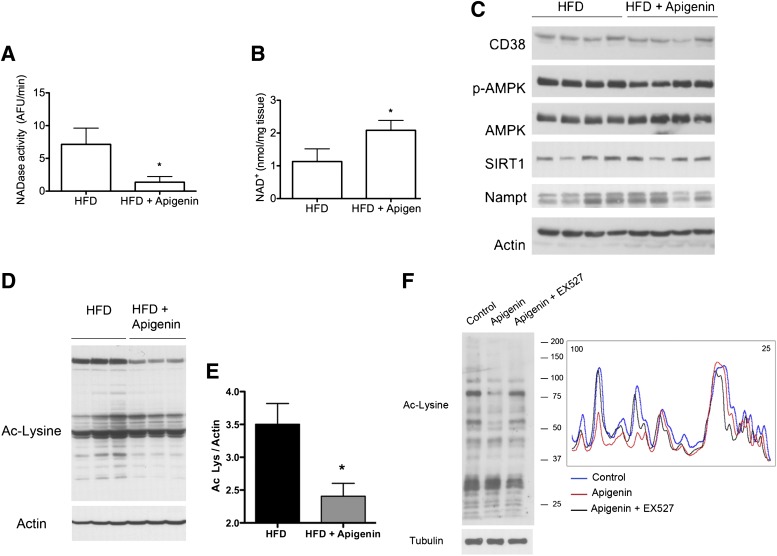
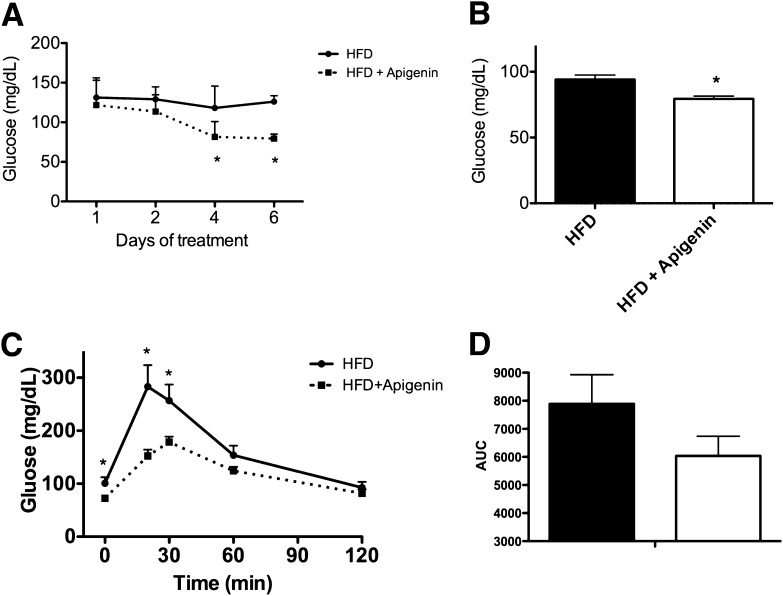
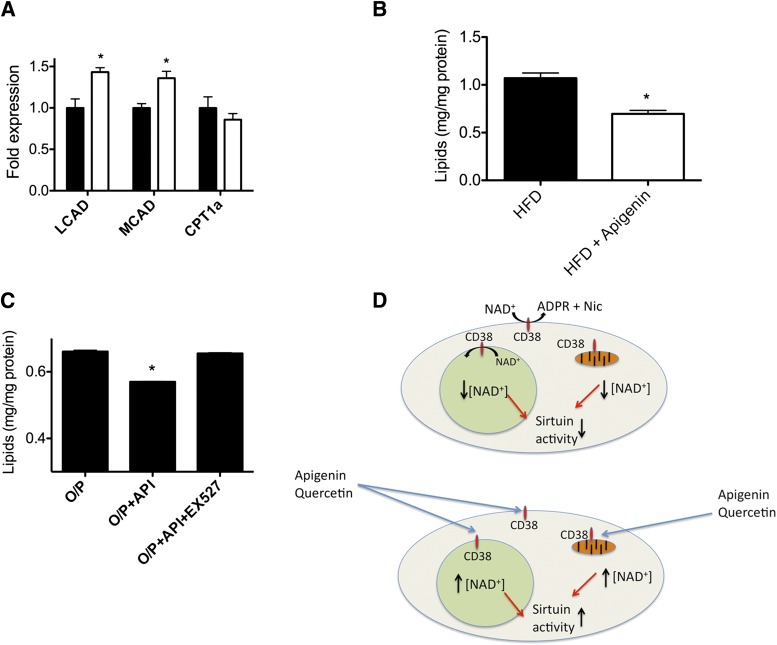
Metabolic syndrome is a growing health problem worldwide. It is therefore imperative to develop new strategies to treat this pathology. In the past years, the manipulation of NAD(+) metabolism has emerged as a plausible strategy to ameliorate metabolic syndrome. In particular, an increase in cellular NAD(+) levels has beneficial effects, likely because of the activation of sirtuins. Previously, we reported that CD38 is the primary NAD(+)ase in mammals. Moreover, CD38 knockout mice have higher NAD(+) levels and are protected against obesity and metabolic syndrome. Here, we show that CD38 regulates global protein acetylation through changes in NAD(+) levels and sirtuin activity. In addition, we characterize two CD38 inhibitors: quercetin and apigenin. We show that pharmacological inhibition of CD38 results in higher intracellular NAD(+) levels and that treatment of cell cultures with apigenin decreases global acetylation as well as the acetylation of p53 and RelA-p65. Finally, apigenin administration to obese mice increases NAD(+) levels, decreases global protein acetylation, and improves several aspects of glucose and lipid homeostasis. Our results show that CD38 is a novel pharmacological target to treat metabolic diseases via NAD(+)-dependent pathways.


Figures

FIG. 1.
FIG. 1.
CD38 overexpression decreases NAD+ and promotes protein acetylation in cells. 293T cells were transfected with empty vector or human CD38-coding vector. After 48 h, cells were harvested, and NAD+ase activity (A), ADP-ribosyl-cyclase activity (B), and total intracellular NAD+ levels (C) were measured in cell lysates. *P < 0.05, n = 3. D: Western blot for CD38 in 293T cells transfected with empty vector or with human CD38. E: Western blot showing total protein acetylation in cells transfected with empty vector or with human CD38. Anti–acetylated (Ac) lysine antibody was used. Red arrows highlight the main bands that showed variations in intensity. F: Intensity profile of the Western blot shown in E. Western blots were scanned and intensity profile was obtained using ImageJ. Red arrows correspond with intensity of the same bands shown in E.
FIG. 2.
FIG. 2.
CD38 downregulation increases NAD+ and decreases protein acetylation in cells. A549 cells were transfected with a scrambled siRNA (control siRNA) or human CD38 siRNA. After 72 h, cells were harvested and NAD+ase activity (A), ADP-ribosyl-cyclase activity (B), and total intracellular NAD+ levels (C) were measured from cell lysates. *P < 0.05, n = 3. D: Western blot showing total protein acetylation in cells transfected with control siRNA or with human CD38 siRNA. Anti–acetylated (Ac) lysine antibody was used. Red arrows highlight the main bands that showed variations in intensity. E: Intensity profile of the Western blot shown in D. Western blots were scanned and intensity profile was obtained using Image J. Red arrows correspond with intensity of the same bands showed in D. FH: Primary MEFs were purified and cultured from wild-type (WT) and CD38 knockout (KO) mice. F: Intracellular NAD+ levels (*P < 0.05, n = 3). G: Western blot from wild-type and CD38 knockout MEFs showing total protein acetylation in these cells. H: Representative Western blot in wild-type and CD38 knockout MEFs. Acetylated RelA/p65 (K310), total RelA/p65, SIRT1, CD38, and actin antibodies were used.
FIG. 3.
FIG. 3.
The flavonoids apigenin and quercetin inhibit CD38 activity in vitro. A: Chemical structure of apigenin. B and C: In vitro NAD+ase (B) and ADP-ribosyl-cyclase (C) activity using human recombinant-purified CD38 and different concentrations of apigenin. D: Chemical structure of quercetin. E and F: In vitro CD38 NAD+ase activity (E) and ADP-ribosyl-cyclase activity (F) using human recombinant-purified CD38 and different concentrations of apigenin. In all the measurements, compounds were used in the 0.5–100 μmol/L concentration range. Each measurement was done by triplicate. Data points were fitted to a standard competitive inhibition curve using a nonlinear regression program (GraphPad Prism) to yield the IC50 value.
FIG. 4.
FIG. 4.
CD38 inhibition by quercetin increases NAD+ levels in cells. A: Endogenous CD38 NAD+ase activity was measured in protein lysates from A549 cells. Quercetin was used in the 0.5–100 μmol/L concentration range. Each measurement was done in triplicate. Data points were fitted to a standard competitive inhibition curve using a nonlinear regression program (GraphPad Prism) to yield the IC50 value. B: NAD+ dose-response curve in A549 cells treated with quercetin. Cells were incubated with quercetin for 6 h before NAD+ extraction. *P < 0.05, n = 3. C: NAD+ time course in A549 cells incubated in PBS (●) or in PBS plus quercetin (50 μmol/L) (■). *P < 0.05, n = 3. D: Intracellular NAD+ levels in wild-type (WT) and CD38 knockout (KO) MEFs treated with vehicle (control) (■) or with quercetin (50 μmol/L) (□) for 6 h. NAD+ levels were expressed as percent of change with respect to the control for both cells. Total NAD+ levels were significantly higher in CD38 knockout MEFs. (See Fig. 2F.) *P < 0.05, n = 3.
FIG. 5.
FIG. 5.
CD38 inhibition by apigenin increases NAD+ and decreases protein acetylation in cells. A: Endogenous CD38 NAD+ase activity was measured in protein lysates from A549 cells. Apigenin was used in the 2.5–100 μmol/L concentration range. Each measurement was done in triplicate. Data points were fitted to a standard competitive inhibition curve using a nonlinear regression program (GraphPad Prism) to yield the IC50 value. B: NAD+ dose-response curve in A549 cells treated with apigenin. Cells were incubated with apigenin for 6 h before NAD+ extraction. C: NAD+ time course in A549 cells incubated in PBS (●) or in PBS plus 25 μmol/L apigenin (■) (*P < 0.05, n = 3). D: Intracellular NAD+ levels in wild-type (WT) and CD38 knockout (KO) MEFs treated with vehicle (control) (■) or with apigenin (25 μmol/L) (□) for 6 h. NAD+ levels were expressed as percent change with respect to the control for both cells. Total NAD+ levels were significantly higher in CD38 knockout MEFs. (See Fig. 2F.) *P < 0.05, n = 3. E: Western blot of wild-type and CD38 knockout MEFs that were treated with vehicle or apigenin as described in D. Samples were immunoblotted for acetylated (Ac)-p65 (K310), total p65, CD38, SIRT1, and actin. F: In vitro SIRT1 activity using recombinant-purified human SIRT1. SIRT1 activity was measured in the presence of different concentrations of apigenin (0–100 μmol/L). Activity was determined in the linear portion of the reaction.
FIG. 6.
FIG. 6.
CD38 inhibition by apigenin increases NAD+ and decreases protein acetylation in vivo. AE: Mice were fed a high-fat diet (HFD) for 4 weeks and then split in two groups. One group was injected with apigenin (100 mg/kg i.p.) and the other with vehicle (DMSO) with a single dose daily for 1 week. A: CD38 activity in the liver at the end of the treatment with apigenin (*P < 0.05, n = 6 animals per group). B: NAD+ levels in the liver after the treatment (*P < 0.05, n = 6 animals per group). C: At the end of the treatment, liver samples were obtained and immunoblotted for CD38, phosphorylated (p)-AMPK (Thr172), AMPK, SIRT1, Nampt, and actin. D: Liver samples were immunoblotted for global acetylation of proteins using an anti–acetylated (Ac) lysine (Lys) antibody. Western blots were scanned and an intensity profile was obtained using Image J. The area under the curve is shown. (*P < 0.05, n = 3 per group.) F: Human HepG2 cells were incubated with vehicle (DMSO), apigenin (25 μmol/L), or apigenin plus EX527 (10 μmol/L) for 6 h. Cell lysates were immunoblotted for acetylated lysine to determine total protein acetylation levels (left panel). The intensity profile of the Western blot was obtained using Image J (right panel).
FIG. 7.
FIG. 7.
CD38 inhibition by apigenin improves glucose homeostasis in vivo and improves lipid metabolism in the liver. Mice were fed a high-fat diet (HFD) for 4 weeks and then split in two groups. One group was injected with apigenin (100 mg/kg i.p.) and the other with vehicle (DMSO) with a single dose daily for 1 week. A: Blood glucose levels were measured during the week of apigenin treatment in ad libitum feeding conditions (*P < 0.05, n = 6 per group). ●, HFD; ■, HFD plus apigenin. B: Blood glucose levels were measured after 24 h of fasting on day 7 of treatment with apigenin (*P < 0.05, n = 6 per group). C: Glucose tolerance test in mice after 7 days of treatment with apigenin (■) or vehicle (●) (*P < 0.05, n = 6 per group). D: Area under the curve (AUC) calculated for the glucose tolerance test shown in C. ■, HFD; □, HFD plus apigenin.
FIG. 8.
FIG. 8.
CD38 inhibition by apigenin promotes fatty acid oxidation in the liver. A: mRNA expression of lipid oxidation markers LCAD, MCAD, and CPT1a in the liver measured by RT-PCR in mice treated with apigenin (□) or vehicle (■) (*P < 0.05, n = 6 per group). B: Total triglyceride (TG) content in the liver of mice treated with apigenin or vehicle (*P < 0.05, n = 6 per group). HFD, high-fat diet. C: Total triglycerides levels in HepG2 cells incubated with 0.5 mmol/L oleate/palmitate (O/P) (2:1 ratio), oleate/palmitate plus 25 μmol/L apigenin (API), or oleate/palmitate plus apigenin plus 10 μmol/L EX527 (*P < 0.05, n = 3). D: Working model for apigenin and quercetin effect on CD38. In cells, CD38 maintains low intracellular NAD+ levels with a consequent low sirtuin activity. The inhibition of CD38 in different subcellular compartments leads to an increase in NAD+ levels, which becomes available for sirtuin activation. We propose that the effect of apigenin will activate nuclear and cytoplasmic and also mitochondrial sirtuins, where CD38 has been shown to be expressed.

Similar articles

Cited by

References

    1. Hedley AA, Ogden CL, Johnson CL, Carroll MD, Curtin LR, Flegal KM. Prevalence of overweight and obesity among US children, adolescents, and adults, 1999-2002. JAMA 2004;291:2847–2850 - PubMed
    1. Popkin BM, Adair LS, Ng SW. Global nutrition transition and the pandemic of obesity in developing countries. Nutr Rev 2012;70:3–21 - PMC - PubMed
    1. Spiegel AM, Alving BM. Executive summary of the Strategic Plan for National Institutes of Health Obesity Research. Am J Clin Nutr 2005;82(Suppl.):211S–214S - PubMed
    1. Eckel RH, Grundy SM, Zimmet PZ. The metabolic syndrome. Lancet 2005;365:1415–1428 - PubMed
    1. Barbosa MT, Soares SM, Novak CM, et al. The enzyme CD38 (a NAD glycohydrolase, EC 3.2.2.5) is necessary for the development of diet-induced obesity. FASEB J 2007;21:3629–3639 - PubMed

MeSH terms