

Home blood pressure variability as cardiovascular risk factor in the population of Ohasama
- PMID: 23172933
- PMCID: PMC3607332
- DOI: 10.1161/HYPERTENSIONAHA.111.00138
Home blood pressure variability as cardiovascular risk factor in the population of Ohasama
Abstract
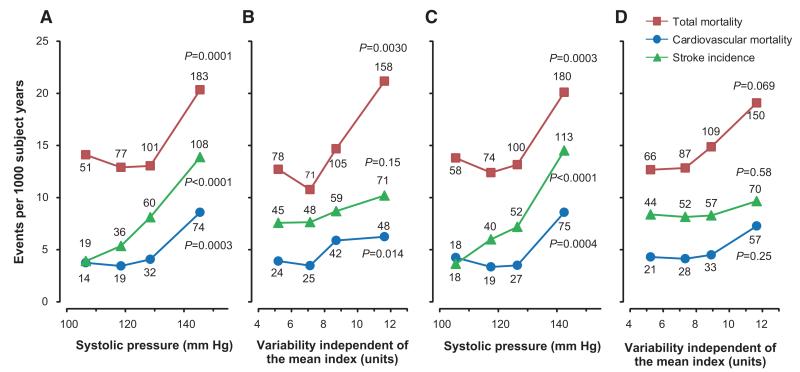
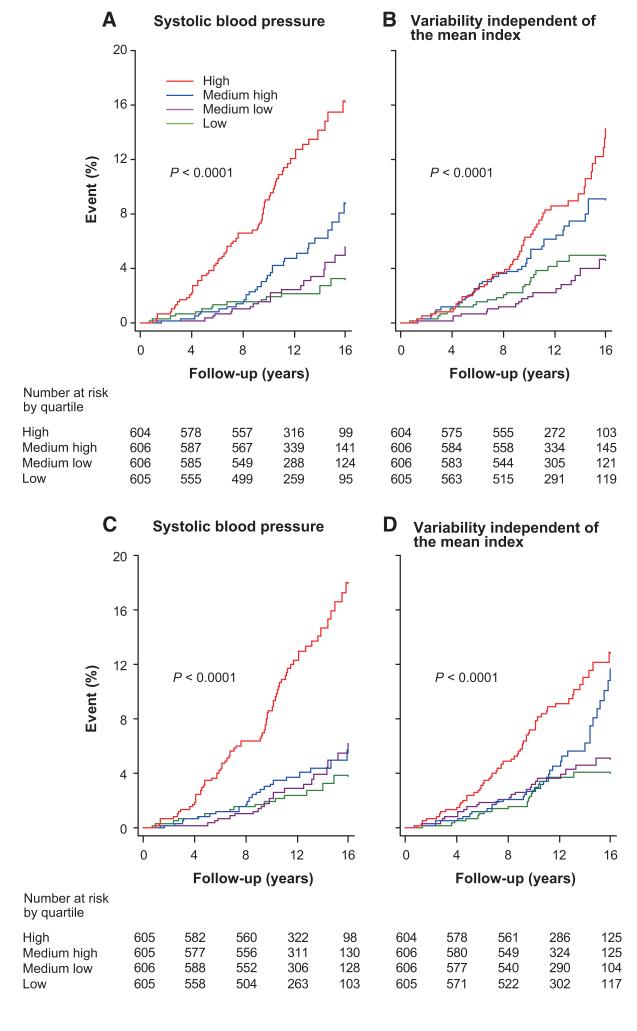
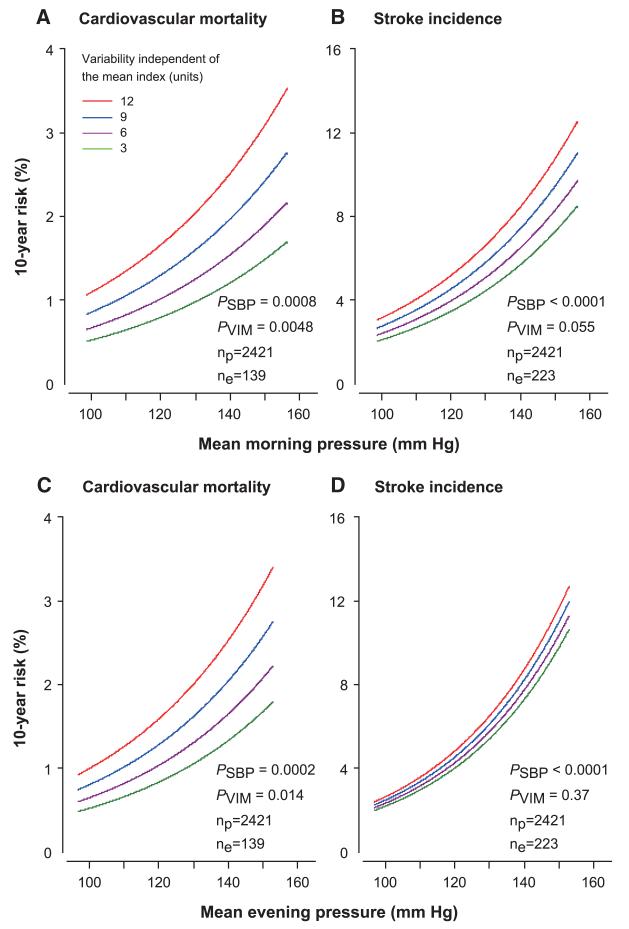
Blood pressure variability based on office measurement predicts outcome in selected patients. We explored whether novel indices of blood pressure variability derived from the self-measured home blood pressure predicted outcome in a general population. We monitored mortality and stroke in 2421 Ohasama residents (Iwate Prefecture, Japan). At enrollment (1988-1995), participants (mean age, 58.6 years; 60.9% women; 27.1% treated) measured their blood pressure at home, using an oscillometric device. In multivariable-adjusted Cox models, we assessed the independent predictive value of the within-subject mean systolic blood pressure (SBP) and corresponding variability as estimated by variability independent of the mean, difference between maximum and minimum blood pressure, and average real variability. Over 12.0 years (median), 412 participants died, 139 of cardiovascular causes, and 223 had a stroke. In models including morning SBP, variability independent of the mean and average real variability (median, 26 readings) predicted total and cardiovascular mortality in all of the participants (P≤0.044); variability independent of the mean predicted cardiovascular mortality in treated (P=0.014) but not in untreated (P=0.23) participants; and morning maximum and minimum blood pressure did not predict any end point (P≥0.085). In models already including evening SBP, only variability independent of the mean predicted cardiovascular mortality in all and in untreated participants (P≤0.046). The R(2) statistics, a measure for the incremental risk explained by adding blood pressure variability to models already including SBP and covariables, ranged from <0.01% to 0.88%. In a general population, new indices of blood pressure variability derived from home blood pressure did not incrementally predict outcome over and beyond mean SBP.
Figures
References
-
- Parati G, Stergiou GS, Asmar R, Bilo G, de Leeuw P, Imai Y, Kario K, Lurbe E, Manolis A, Mengden T, O’Brien E, Ohkubo T, Padfield P, Palatini P, Pickering T, et al. ESH Working Group on Blood Pressure Monitoring. European Society of Hypertension guidelines for blood pressure monitoring at home: a summary report of the Second International Consensus Conference on Home Blood Pressure Monitoring. J Hypertens. 2008;26:1505–1526. - PubMed
-
- Mancia G, De Backer G, Dominiczak A, Cifkova R, Fagard R, Germano G, Grassi G, Heagerty AM, Kjeldsen SE, Laurent S, Narkiewicz K, Ruilope L, Rynkiewicz A, Schmieder RE, Struijker Boudier HA, Zanchetti A, et al. The task force for the management of arterial hypertension of the European Society of Hypertension, The task force for the management of arterial hypertension of the European Society of Cardiology 2007 Guidelines for the management of arterial hypertension: The Task Force for the Management of Arterial Hypertension of the European Society of Hypertension (ESH) and of the European Society of Cardiology (ESC) Eur Heart J. 2007;28:1462–1536. - PubMed
-
- Ogihara T, Kikuchi K, Matsuoka H, Fujita T, Higaki J, Horiuchi M, Imai Y, Imaizumi T, Ito S, Iwao H, Kario K, Kawano Y, Kim-Mitsuyama S, Kimura G, Matsubara H, et al. Japanese Society of Hypertension Committee The Japanese Society of Hypertension Guidelines for the Management of Hypertension (JSH 2009) Hypertens Res. 2009;32:3–107. - PubMed
-
- Ohkubo T, Imai Y, Tsuji I, Nagai K, Kato J, Kikuchi N, Nishiyama A, Aihara A, Sekino M, Kikuya M, Ito S, Satoh H, Hisamichi S. Home blood pressure measurement has a stronger predictive power for mortality than does screening blood pressure measurement: a population-based observation in Ohasama, Japan. J Hypertens. 1998;16:971–975. - PubMed
-
- Asayama K, Ohkubo T, Kikuya M, Obara T, Metoki H, Inoue R, Hara A, Hirose T, Hoshi H, Hashimoto J, Totsune K, Satoh H, Imai Y. Prediction of stroke by home “morning” versus “evening” blood pressure values: the Ohasama study. Hypertension. 2006;48:737–743. - PubMed
Publication types
MeSH terms
Grants and funding
LinkOut - more resources
Full Text Sources
Other Literature Sources
Medical
