

GENE EXPRESSION PROFILING OF HUMAN LIVER CARCINOMA (HepG2) CELLS EXPOSED TO THE MARINE TOXIN OKADAIC ACID
- PMID: 23172983
- PMCID: PMC3500632
- DOI: 10.1080/02772248.2012.730199
GENE EXPRESSION PROFILING OF HUMAN LIVER CARCINOMA (HepG2) CELLS EXPOSED TO THE MARINE TOXIN OKADAIC ACID
Abstract
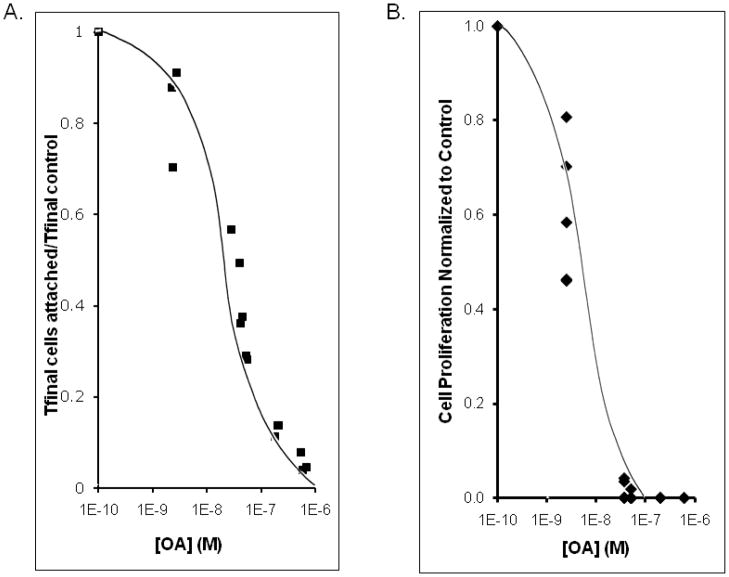
The marine toxin, okadaic acid (OA) is produced by dinoflagellates of the genera Prorocentrum and Dinophysis and is the causative agent of the syndrome known as diarrheic shellfish poisoning (DSP). In addition, OA acts as both a tumor promoter, attributed to OA-induced inhibition of protein phosphatases as well as an inducer of apoptosis. To better understand the potentially divergent toxicological profile of OA, the concentration dependent cytotoxicity and alterations in gene expression on the human liver tumor cell line HepG2 upon OA exposure were determined using RNA microarrays, DNA fragmentation, and cell proliferation assays as well as determinations of cell detachment and cell death in different concentrations of OA. mRNA expression was quantified for approximately 15,000 genes. Cell attachment and proliferation were both negatively correlated with OA concentration. Detached cells displayed necrotic DNA signatures but apoptosis also was broadly observed. Data suggest that OA has a concentration dependent effect on cell cycle, which might explain the divergent effects that at low concentration OA stimulates genes involved in the cell cycle and at high concentrations it stimulates apoptosis.
Figures


References
-
- Andrievski A, Wilkins RC. The response of gamma-H2AX in human lymphocytes and lymphocytes subsets measured in whole blood cultures. Int J Radiat Biol. 2009;85:369–376. - PubMed
-
- Barford D. Molecular mechanisms of the protein serine/threonine phosphatases. Trends Biochem Sci. 1996;11:407–412. - PubMed
-
- Botos E, Turi A, Mullner N, Kovalszky I, Tatrai P, Kiss AL. Regulatory role of kinases and phosphatases on the internalization of caveolae in HepG2 cells. Micron. 2007;38:313–320. - PubMed
-
- Blankson H, Holen I, Seglen PO. Disruption of the cytokeratin cytoskeleton and inhibition of hepatocytic autophagy by okadaic acid. Exp Cell Res. 1995;218:522–530. - PubMed
-
- Carvalho Pinto-Silva CR, Ferreira JF, Costa RH, Belli Filho P, Creppy EE, Matias WG. Micronucleus induction in mussels exposed to okadaic acid. Toxicon. 2003;41:93–97. - PubMed
Grants and funding
LinkOut - more resources
Full Text Sources
Research Materials
Miscellaneous