. 2012;7(11):e49371.
doi: 10.1371/journal.pone.0049371. Epub 2012 Nov 16.

New alternately colored FRET sensors for simultaneous monitoring of Zn²⁺ in multiple cellular locations

Affiliations

New alternately colored FRET sensors for simultaneous monitoring of Zn²⁺ in multiple cellular locations

Jose G Miranda et al. PLoS One. 2012.

Abstract

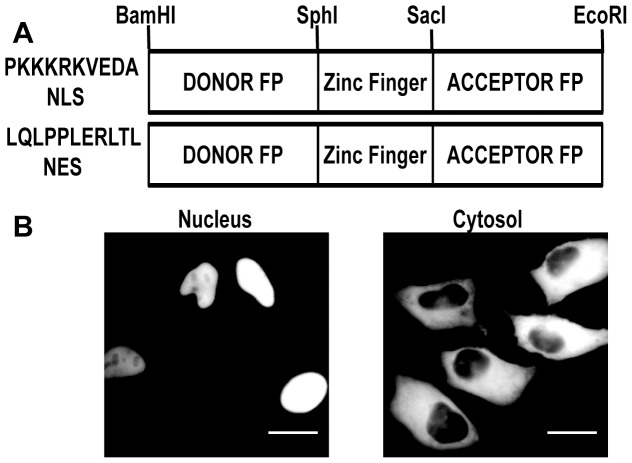
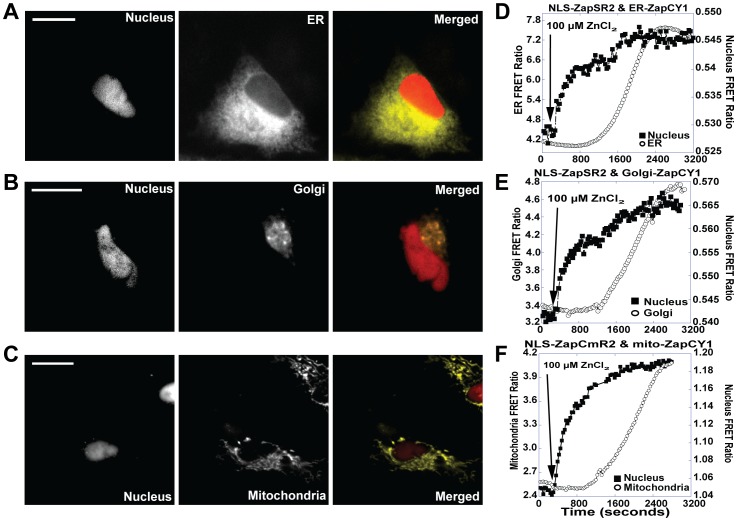
Genetically encoded sensors based on fluorescence resonance energy transfer (FRET) are powerful tools for reporting on ions, molecules and biochemical reactions in living cells. Here we describe the development of new sensors for Zn²⁺based on alternate FRET-pairs that do not involve the traditional CFP and YFP. Zn²⁺ is an essential micronutrient and plays fundamental roles in cell biology. Consequently there is a pressing need for robust sensors to monitor Zn²⁺ levels and dynamics in cells with high spatial and temporal resolution. Here we develop a suite of sensors using alternate FRET pairs, including tSapphire/TagRFP, tSapphire/mKO, Clover/mRuby2, mOrange2/mCherry, and mOrange2/mKATE. These sensors were targeted to both the nucleus and cytosol and characterized and validated in living cells. Sensors based on the new FRET pair Clover/mRuby2 displayed a higher dynamic range and better signal-to-noise ratio than the remaining sensors tested and were optimal for monitoring changes in cytosolic and nuclear Zn²⁺. Using a green-red sensor targeted to the nucleus and cyan-yellow sensor targeted to either the ER, Golgi, or mitochondria, we were able to monitor Zn²⁺ uptake simultaneously in two compartments, revealing that nuclear Zn²⁺ rises quickly, whereas the ER, Golgi, and mitochondria all sequester Zn²⁺ more slowly and with a delay of 600-700 sec. Lastly, these studies provide the first glimpse of nuclear Zn²⁺ and reveal that nuclear Zn²⁺ is buffered at a higher level than cytosolic Zn²⁺.


Conflict of interest statement

Competing Interests: The authors have declared that no competing interests exist.

Figures

Figure 1
Figure 1. Nuclear Localization and Nuclear Exclusion Signal Sequence constructs.
A NLS and NES were cloned into pcDNA 3.1 (+) vector upstream BamH I. A) Schematic of FRET sensor construct. B) Representative images of transfected sensor showing localization to either the nucleus or cytosol. Scale bar = 20 µm.
Figure 2
Figure 2. FRET Sensor calibration in the nucleus.
Representative calibrations of each sensor localized to the nucleus. The background corrected FRET ratio (FRET Intensity ÷ Donor Intensity) is represented as a function of time. Calibrations were performed by adding 150 µM TPEN to achieve RTPEN, followed by washing of residual TPEN and addition of 135 µM ZnCl2 with 10 µM Digitonin to permeabilize the cell membrane and obtain RZn. A) NLS-ZapSM2 FRET ratio increases slightly above resting suggesting that it is close to saturation at rest; B) NLS-ZapSR2, FRET ratio goes above resting; C) NLS-ZapOC2 has a small decrease in FRET ratio after TPEN and a larger increase after treatment with Zn2+; D) NLS-ZapOK2 exhibits a small change in FRET ratio after TPEN and Zn2+; E) NLS-ZapCmR1 has an inverted response in which TPEN causes an increase in FRET ratio while Zn2+ with digitonin causes a decrease in the ratio; F) NLS-ZapCmR1.1 displays a decrease in the FRET ratio after TPEN and large increase with Zn2+ and digitonin; G) NLS-ZapCmR2 is similar to ZapCmR1.1. Representative traces are mean ± s.e.m. (n = 4 cells). Each experiment was repeated a minimum of three times.
Figure 3
Figure 3. FRET Sensor calibration in the cytosol.
Representative calibrations of each sensor localized to the cytosol The background corrected FRET ratio (FRET Intensity ÷ Donor Intensity) is represented as a function of time. Calibrations were performed by adding 150 µM TPEN to achieve RTPEN, followed by washing of residual TPEN and addition of 135 µM ZnCl2 with 10 µM Digitonin to permeabilize the cell membrane and obtain RZn. A) NES-ZapSM2, FRET ratio goes slightly above resting; B) NES-ZapSR2 has a similar response as observed in the nucleus, Figure 2B; C) NES-ZapOC2 demonstrates a small decrease after TPEN compared to the same sensor in the nucleus; D) NES-ZapOK2 is observed with small changes in FRET ratio after TPEN and Zn2+/digitonin; E) NES-ZapCmR1 has an inverted response in which TPEN causes an increase in FRET ratio while Zn2+ with digitonin causes a decrease in the ratio; F) NES-ZapCmR1.1 and G) NES-ZapCmR2 exhibit a small decrease with TPEN and a larger increase in FRET ratio after addition of Zn2+ and digitonin. Representative traces are mean ± s.e.m. (n = 4 cells). Each experiment was repeated a minimum of three times.
Figure 4
Figure 4. Simultaneous monitoring of cytosolic and nuclear Zn2+ uptake.
(A) Simultaneous imaging of NLS-ZapSR2 and NES-ZapCY2 in the same cell. (B) Simultaneous imaging of NLS-ZapOC2 and NES-ZapCY2 in the same cell. In both experiments 100 µM ZnCl2 was added at the time indicated. The rate of increase in the FRET ratio is essentially the same in both locations, suggesting similar rates for nuclear and cytosolic uptake. C) Left panel (cytosol) is NES-ZapCY2 and circles represent ROI followed throughout experiment, middle panel represents NLS-ZapSR2, circles represent ROI (NLS-ZapOC2 not shown), and right panel represents NLS-ZapSR2 and NES-ZapCY2 merged. Images were bleedthrough corrected. Experiments were repeated at least five times with a minimum of 1–2 cells per experiment. Scale bar = 20 µm.
Figure 5
Figure 5. Simultaneous monitoring of Zn2+ uptake into the nucleus and either the endoplasmic reticulum, Golgi apparatus, or mitochondria.
Representative images (FRET channel) and FRET ratio traces of Zn2+ uptake into the nucleus, ER, Golgi, or mitochondria. A) Image of nuclear and ER FRET sensor, left panel illustrates NLS-ZapSR2, middle panel ER-ZapCY1 and right panel is a pseudo-color merged image of NLS-ZapSR2 and ER-ZapCY1. B) Image of nuclear and ER FRET sensor, left panel illustrates NLS-ZapSR2, middle panel Golgi-ZapCY1 and right panel is a pseudo- color merged image of NLS-ZapSR2 and Golgi-ZapCY1. C) Image of nuclear and mitochondrial FRET sensor, left panel illustrates NLS-ZapCmR2, middle panel mitochondria-ZapCY1 and right panel is a pseudo- color merged image of NLS-ZapCmR2 and mitochondria-ZapCY1. D-F) FRET ratio traces of NLS-ZapSR2 or NLS-ZapCmR2 with ER-, Golgi-, and mitochondrial-ZapCY1 upon addition of 100 µM extracellular ZnCl2 at the time indicated. The nuclear FRET ratio rises more rapidly than organelle FRET ratio. The organelle FRET ratio begins to increase approximately 600 seconds post-Zn2+. Experiments were repeated at least five times with a minimum of 1–2 cells per experiment. All images were bleedthrough corrected. Scale bar = 20 µm.

References

    1. Shaner NC, Steinbach PA, Tsien RY (2005) A guide to choosing fluorescent proteins. Nat Methods 2: 905–909. - PubMed
    1. VanEngelenburg SB, Palmer AE (2008) Fluorescent biosensors of protein function. Curr Opin Chem Biol 12: 60–65. - PubMed
    1. Newman RH, Fosbrink MD, Zhang J (2011) Genetically encodable fluorescent biosensors for tracking signaling dynamics in living cells. Chem Rev 111: 3614–3666. - PMC - PubMed
    1. Carlson HJ, Campbell RE (2009) Genetically encoded FRET-based biosensors for multiparameter fluorescence imaging. Curr Opin Biotechnol 20: 19–27. - PubMed
    1. Ai HW, Hazelwood KL, Davidson MW, Campbell RE (2008) Fluorescent protein FRET pairs for ratiometric imaging of dual biosensors. Nat Methods 5: 401–403. - PubMed

Publication types