

Epithelial-mesenchymal-transition-like and TGFβ pathways associated with autochthonous inflammatory melanoma development in mice
- PMID: 23173060
- PMCID: PMC3500287
- DOI: 10.1371/journal.pone.0049419
Epithelial-mesenchymal-transition-like and TGFβ pathways associated with autochthonous inflammatory melanoma development in mice
Abstract
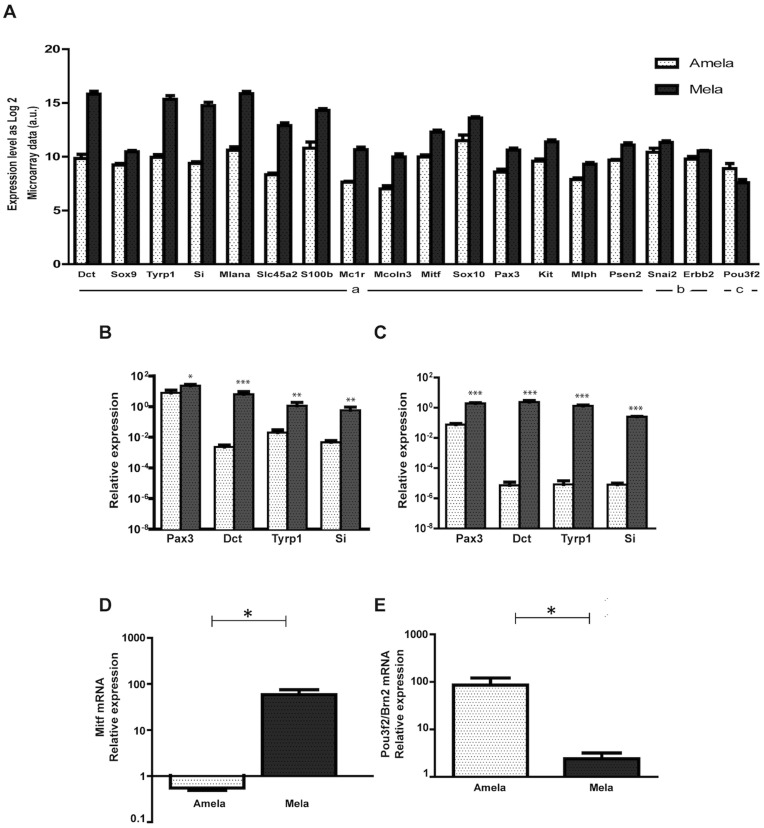
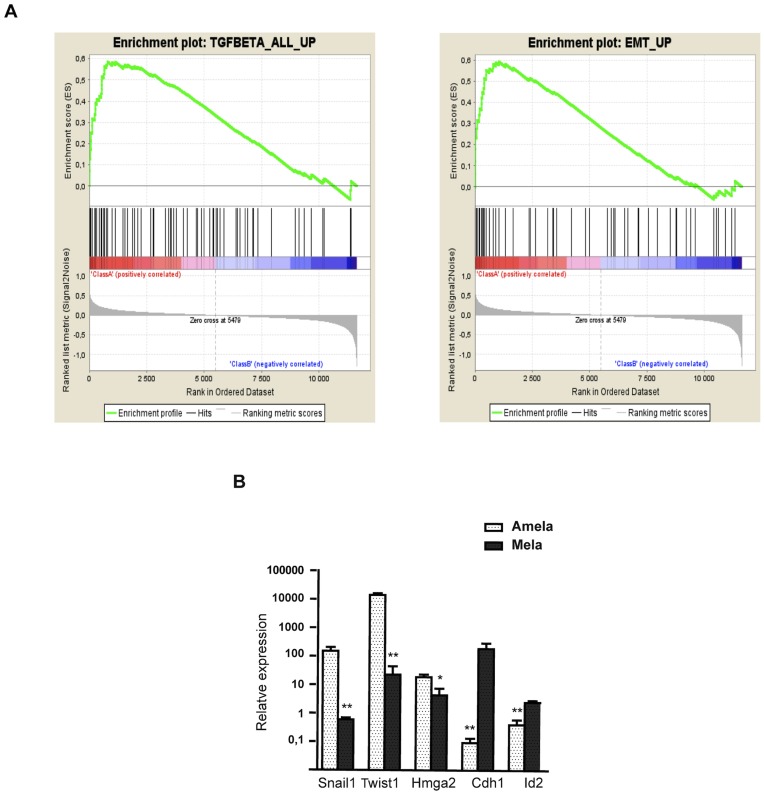
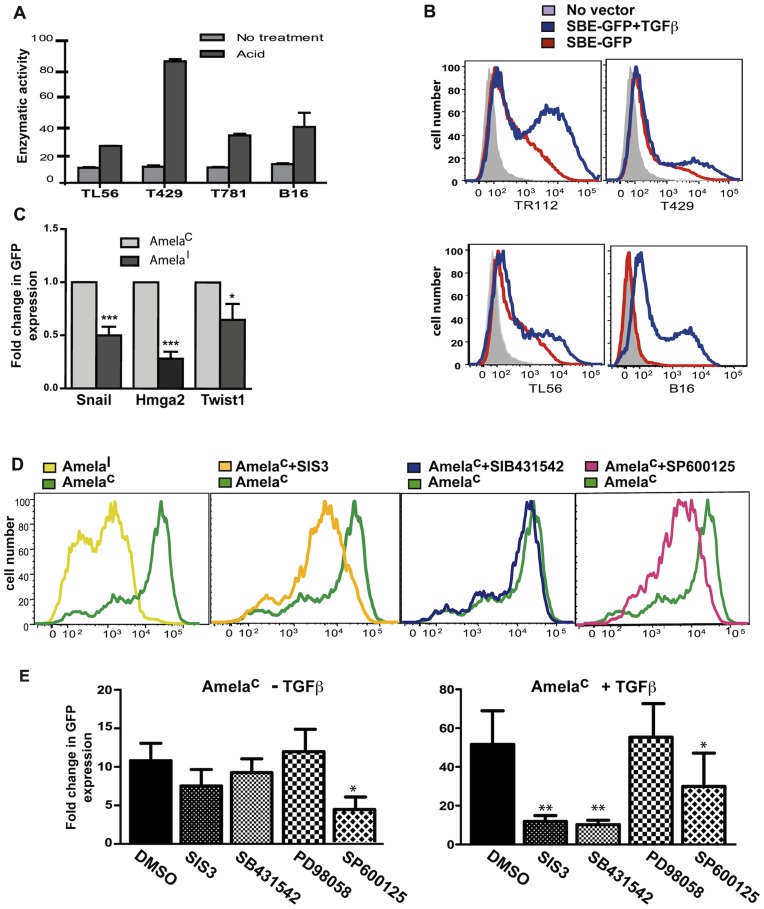
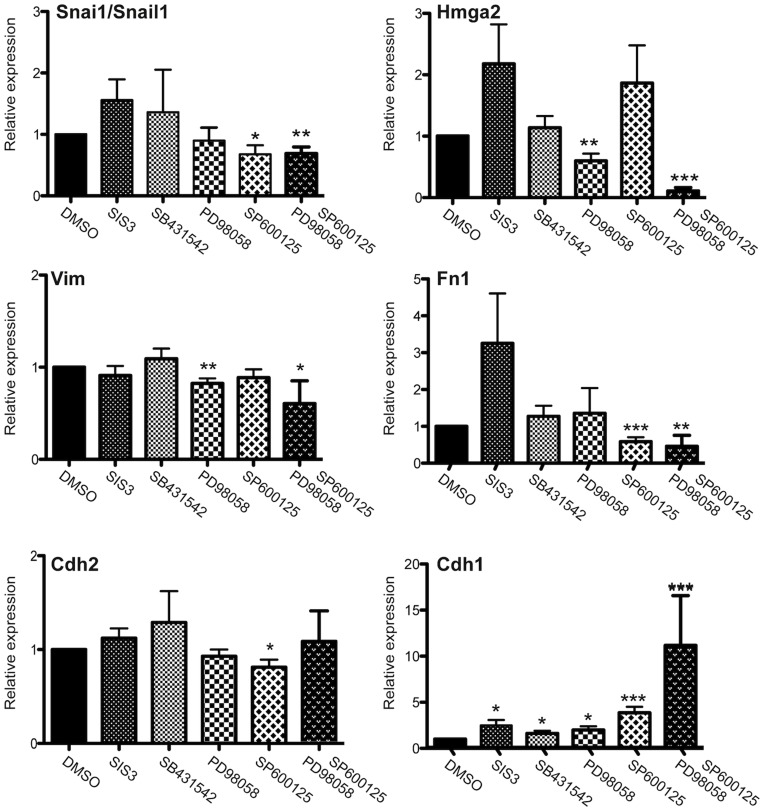
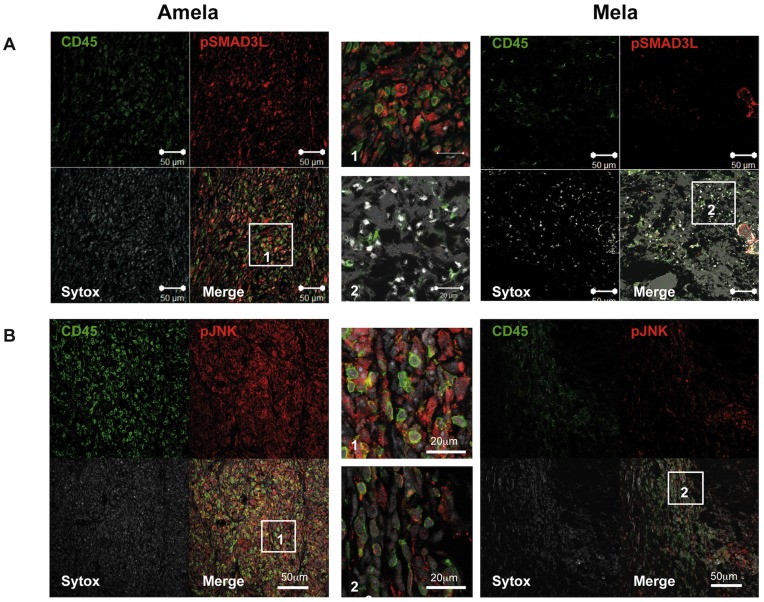
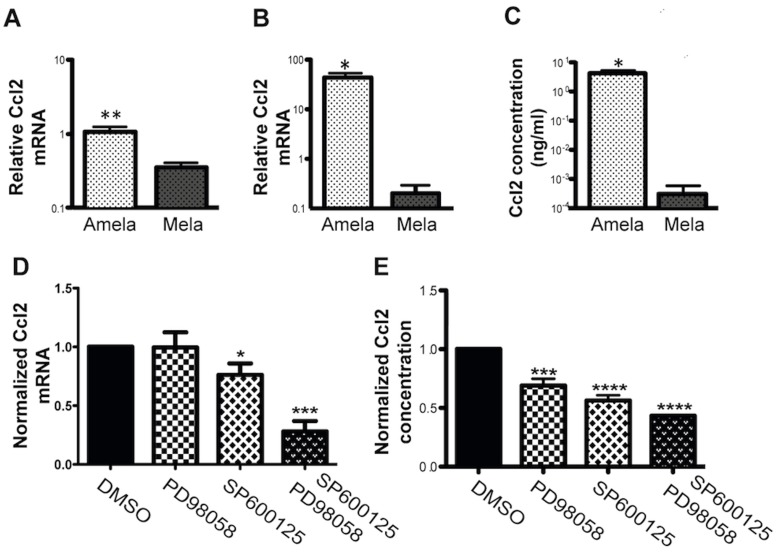
We compared gene expression signatures of aggressive amelanotic (Amela) melanomas with those of slowly growing pigmented melanomas (Mela), identifying pathways potentially responsible for the aggressive Amela phenotype. Both tumors develop in mice upon conditional deletion in melanocytes of Ink4a/Arf tumor suppressor genes with concomitant expression of oncogene H-Ras(G12V) and a known tumor antigen. We previously showed that only the aggressive Amela tumors were highly infiltrated by leukocytes concomitant with local and systemic inflammation. We report that Amela tumors present a pattern of de-differentiation with reduced expression of genes involved in pigmentation. This correlates with reduced and enhanced expression, respectively, of microphthalmia-associated (Mitf) and Pou3f2/Brn-2 transcription factors. The reduced expression of Mitf-controlled melanocyte differentiation antigens also observed in some human cutaneous melanoma has important implications for immunotherapy protocols that generally target such antigens. Induced Amela tumors also express Epithelial-Mesenchymal-Transition (EMT)-like and TGFβ-pathway signatures. These are correlated with constitutive Smad3 signaling in Amela tumors and melanoma cell lines. Signatures of infiltrating leukocytes and some chemokines such as chemotactic cytokine ligand 2 (Ccl2) that contribute to leukocyte recruitment further characterize Amela tumors. Inhibition of the mitogen-activated protein kinase (MAPK) activation pathway in Amela tumor lines leads to reduced expression of EMT hallmark genes and inhibits both proinflammatory cytokine Ccl2 gene expression and Ccl2 production by the melanoma cells. These results indicate a link between EMT-like processes and alterations of immune functions, both being controlled by the MAPK pathway. They further suggest that targeting the MAPK pathway within tumor cells will impact tumor-intrinsic oncogenic properties as well as the nature of the tumor microenvironment.
Conflict of interest statement
Figures
Similar articles
-
A novel stilbene-like compound that inhibits melanoma growth by regulating melanocyte differentiation and proliferation.Toxicol Appl Pharmacol. 2017 Dec 15;337:30-38. doi: 10.1016/j.taap.2017.10.008. Epub 2017 Oct 16. Toxicol Appl Pharmacol. 2017. PMID: 29042215
-
A phosphatidylinositol 3-kinase-Pax3 axis regulates Brn-2 expression in melanoma.Mol Cell Biol. 2012 Nov;32(22):4674-83. doi: 10.1128/MCB.01067-12. Epub 2012 Sep 17. Mol Cell Biol. 2012. PMID: 22988297 Free PMC article.
-
Melanoma cell-derived exosomes promote epithelial-mesenchymal transition in primary melanocytes through paracrine/autocrine signaling in the tumor microenvironment.Cancer Lett. 2016 Jul 1;376(2):318-27. doi: 10.1016/j.canlet.2016.03.050. Epub 2016 Apr 7. Cancer Lett. 2016. PMID: 27063098 Free PMC article.
-
Role of Ras and Mapks in TGFbeta signaling.Cytokine Growth Factor Rev. 2000 Mar-Jun;11(1-2):23-35. doi: 10.1016/s1359-6101(99)00026-x. Cytokine Growth Factor Rev. 2000. PMID: 10708950 Review.
-
Microphthalmia-associated transcription factor expression levels in melanoma cells contribute to cell invasion and proliferation.Exp Dermatol. 2015 Jul;24(7):481-4. doi: 10.1111/exd.12724. Exp Dermatol. 2015. PMID: 25866058 Review.
Cited by
-
IFNγ producing CD8+ T cells modified to resist major immune checkpoints induce regression of MHC class I-deficient melanomas.Oncoimmunology. 2015 Mar 6;4(2):e974959. doi: 10.4161/2162402X.2014.974959. eCollection 2015 Feb. Oncoimmunology. 2015. PMID: 25949872 Free PMC article.
-
Overexpressed VEPH1 inhibits epithelial-mesenchymal transition, invasion, and migration of human cutaneous melanoma cells through inactivating the TGF-β signaling pathway.Cell Cycle. 2019 Nov;18(21):2860-2875. doi: 10.1080/15384101.2019.1638191. Epub 2019 Sep 4. Cell Cycle. 2019. Retraction in: Cell Cycle. 2022 Jul;21(13):1435. doi: 10.1080/15384101.2022.2066278. PMID: 31599708 Free PMC article. Retracted.
-
Apoptosis of tumor-infiltrating T lymphocytes: a new immune checkpoint mechanism.Cancer Immunol Immunother. 2019 May;68(5):835-847. doi: 10.1007/s00262-018-2269-y. Epub 2018 Nov 7. Cancer Immunol Immunother. 2019. PMID: 30406374 Free PMC article. Review.
-
Overexpression of MLPH in Rectal Cancer Patients Correlates with a Poorer Response to Preoperative Chemoradiotherapy and Reduced Patient Survival.Diagnostics (Basel). 2021 Nov 17;11(11):2132. doi: 10.3390/diagnostics11112132. Diagnostics (Basel). 2021. PMID: 34829479 Free PMC article.
-
TGFβ1 neutralization displays therapeutic efficacy through both an immunomodulatory and a non-immune tumor-intrinsic mechanism.J Immunother Cancer. 2021 Feb;9(2):e001798. doi: 10.1136/jitc-2020-001798. J Immunother Cancer. 2021. PMID: 33637600 Free PMC article.
References
-
- Busca R, Ballotti R (2000) Cyclic AMP a key messenger in the regulation of skin pigmentation. Pigment Cell Res 13: 60–69. - PubMed
-
- Herlyn M, Berking C, Li G, Satyamoorthy K (2000) Lessons from melanocyte development for understanding the biological events in naevus and melanoma formation. Melanoma Res 10: 303–312. - PubMed
-
- Huber MA, Kraut N, Beug H (2005) Molecular requirements for epithelial-mesenchymal transition during tumor progression. Curr Opin Cell Biol 17: 548–558. - PubMed
-
- Thiery JP, Sleeman JP (2006) Complex networks orchestrate epithelial-mesenchymal transitions. Nat Rev Mol Cell Biol 7: 131–142. - PubMed
Publication types
MeSH terms
Substances
LinkOut - more resources
Full Text Sources
Other Literature Sources
Medical
Molecular Biology Databases
