

doi: 10.2337/dc12-0684.
Diabetes: have we got it all wrong? Hyperinsulinism as the culprit: surgery provides the evidence
Affiliations
- PMID: 23173133
- PMCID: PMC3507594
- DOI: 10.2337/dc12-0684
Item in Clipboard
Diabetes: have we got it all wrong? Hyperinsulinism as the culprit: surgery provides the evidence
Diabetes Care.
2012 Dec.
No abstract available
Figures
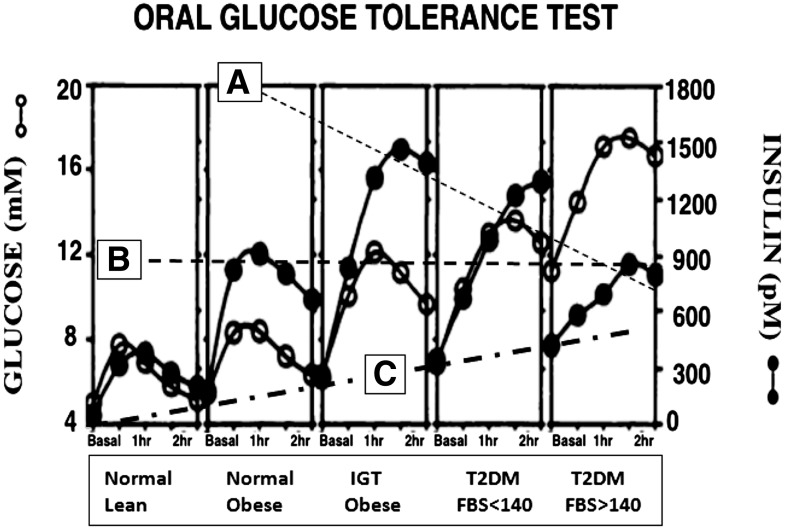
Glucose tolerance curves in five cohorts: normal lean, normal obese, IGT, early T2DM, and advanced T2DM (data previously published [5]). While there is a reduction in peak insulin secretion with progress of T2DM (A), the peak insulin secretion is still higher in advanced disease than in normal subjects (B) and there is an increase in basal insulin secretion (C).
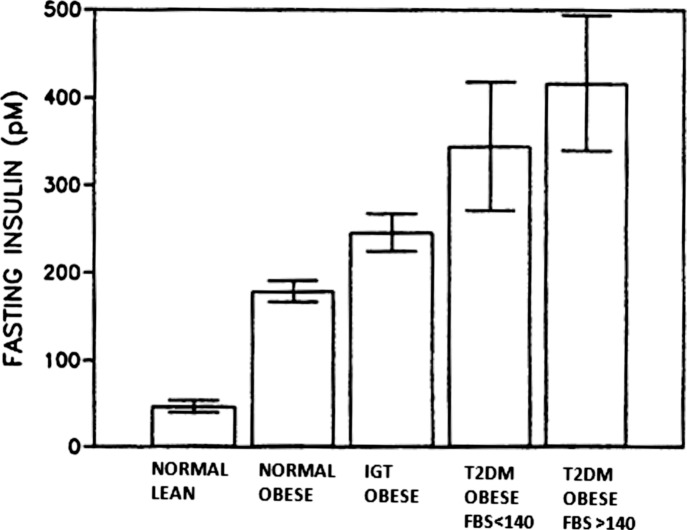
Fasting insulin in normal lean, normal obese, IGT, early T2DM, and advanced T2DM (data previously published [5]).
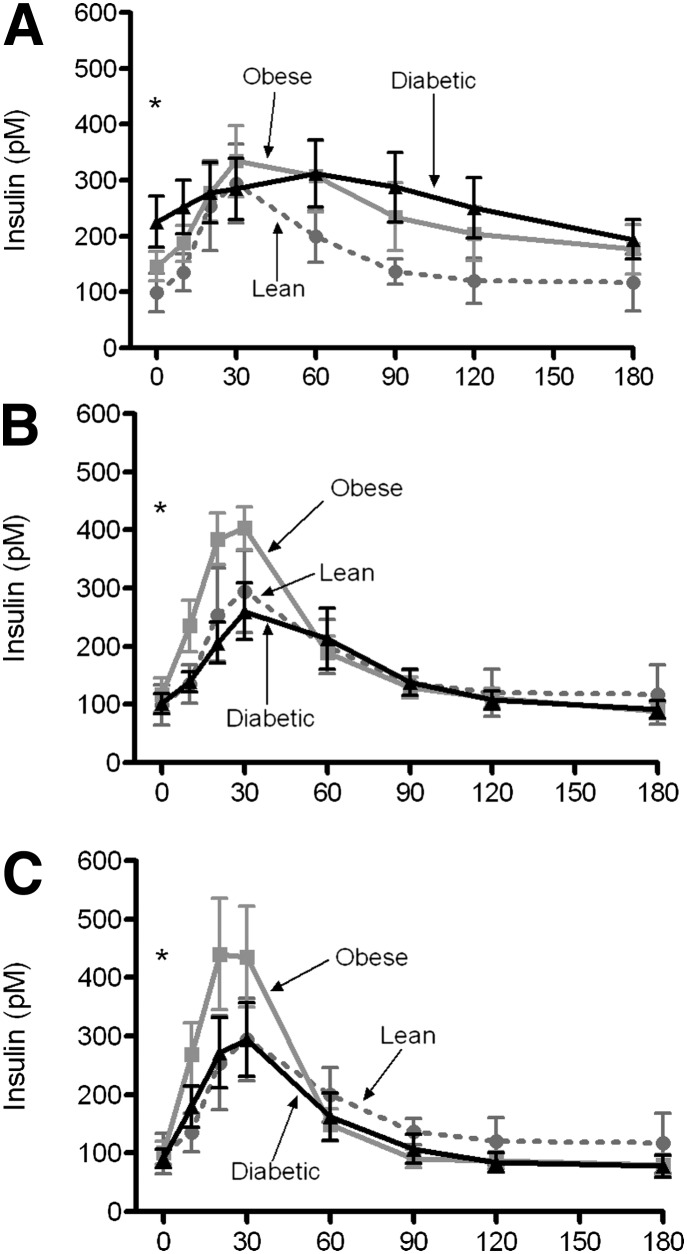
Plasma insulin in obese nondiabetic and diabetic patients after a mixed-meal challenge. Redrawn from the data published by Reed et al. (14). A lean control group is shown each time for comparison before surgery (A), a week after surgery (B), and 3 months after surgery (C).
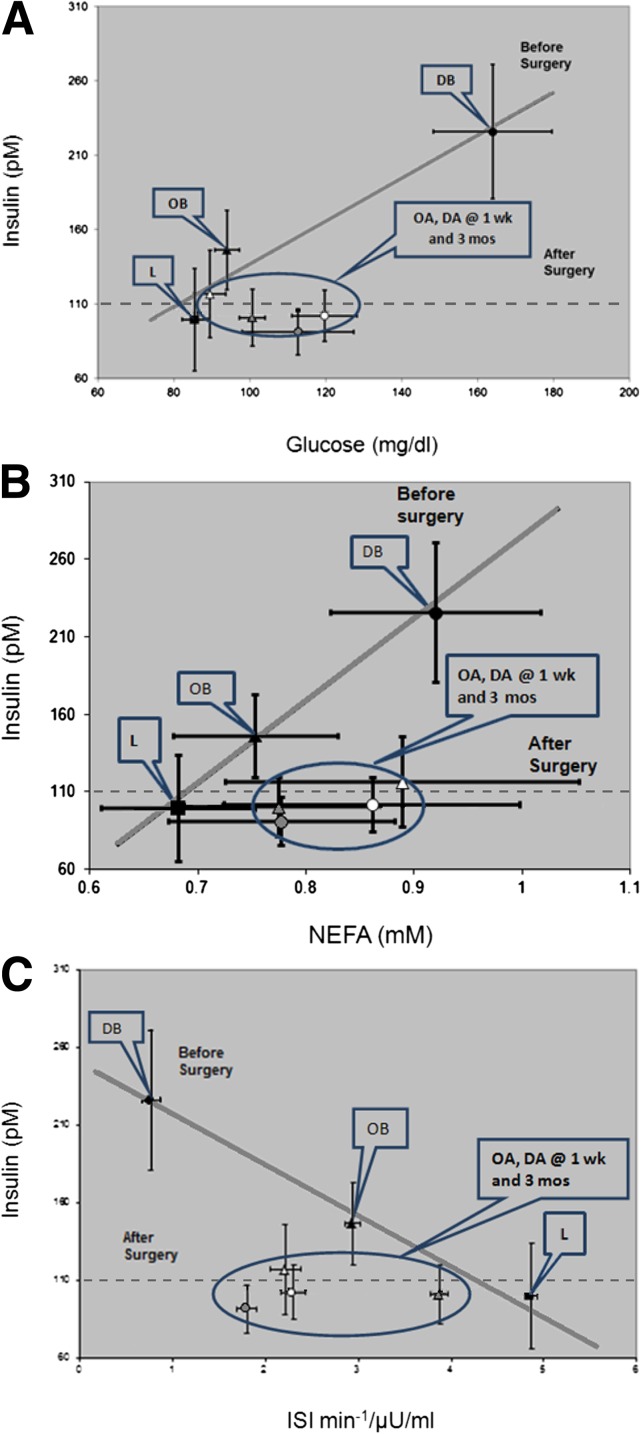
Correlations of fasting insulin with fasting plasma glucose (A), fasting plasma free fatty acids (NEFAs) (B), and insulin sensitivity index (ISI) (C). Fasting glucose, fasting insulin, and ISI were previously reported (14). Group symbols: square = lean control group; triangle = obese (nondiabetic) group; circle = diabetic group. Time symbols: black square, triangle, and circle = presurgery; white triangle and circle = week of surgery; gray triangle and circle = 3 months postsurgery. L = lean control group; OB = obese (nondiabetic) group before surgery; DB = diabetic (obese) group before surgery; OA = obese group after surgery; DA = diabetic group after surgery. wk, week; mos, months.
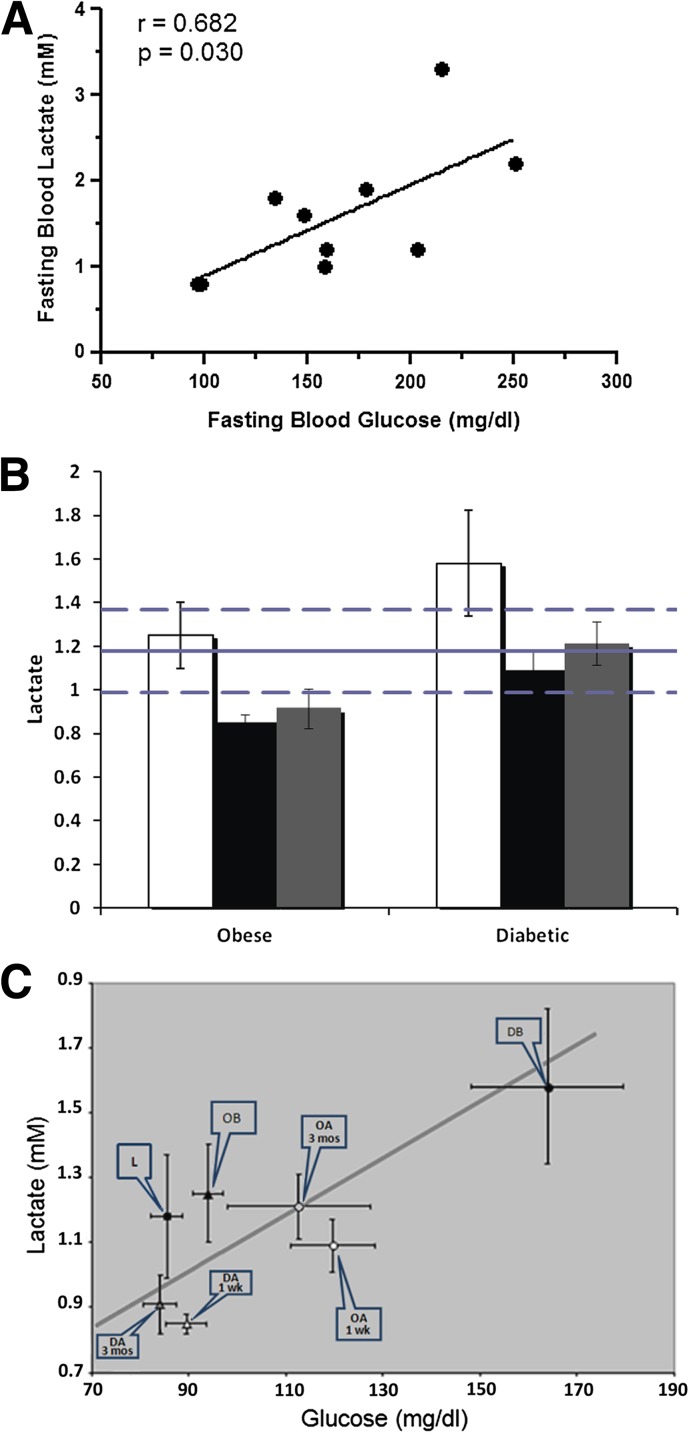
Plasma lactate in normal lean control subjects and in diabetic and nondiabetic (obese) patients before and after RYGB. Fasting plasma samples from the study reported by Reed et al. (14) were analyzed for lactate. A: Correlation of fasting plasma lactate with fasting plasma glucose in diabetic patients before surgery. B: Fasting plasma lactate in diabetic and nondiabetic (obese) patients before and after surgery. The mean value ± SEM for a control lean group is shown as a solid ± the dashed lines. White bars show data prior to surgery, black bars show data at 1 week after surgery, and gray bars show data at 3 months after surgery. C: Correlation of fasting plasma lactate and fasting plasma glucose in lean, obese, and diabetic groups before and after RYGB. Group symbols: square = lean control group; triangle = obese (nondiabetic) group; circle = diabetic group. Time symbols: black square, triangle, and circle = presurgery; white triangle and circle = week of surgery; gray triangle and circle = 3 month postsurgery. L = lean control group; OB = obese (nondiabetic) group before surgery; DB = diabetic (obese) group before surgery; OA = obese group after surgery; DA = diabetic group after surgery. wk, week; mos, months.
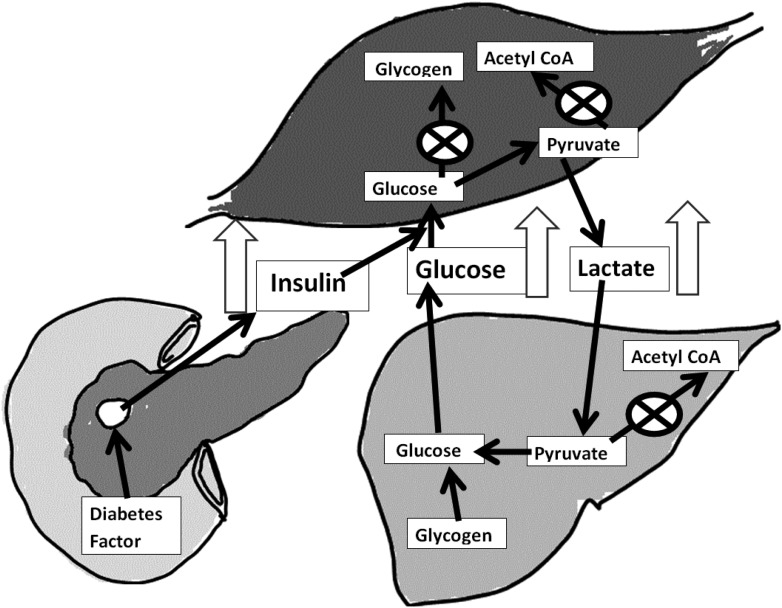
Fasting metabolism in T2DM. When glycogen stores are full and there is no energy demand on the muscle, acetyl-CoA and NADH accumulate. These are feedback regulators of pyruvate dehydrogenase, and thus pyruvate will accumulate. The NADH generated from glycoloysis is used to reduce pyruvate to lactate, which is transported by the blood to the liver where it is converted to glucose by gluconeogenesis.
References
-
- Das AK, Shah S. History of diabetes: from ants to analogs. J Assoc Physicians India 2011;59(Suppl.):6–7 - PubMed
-
- Tipton CM. Susruta of India, an unrecognized contributor to the history of exercise physiology. J Appl Physiol 2008;104:1553–1556 - PubMed
-
- Kim SH. Measurement of insulin action: a tribute to Sir Harold Himsworth. Diabet Med 2011;28:1487–1493 - PubMed
-
- Pories WJ, MacDonald KG, Jr, Morgan EJ, et al. Surgical treatment of obesity and its effect on diabetes: 10-y follow-up. Am J Clin Nutr 1992;55(Suppl.):582S–585S - PubMed
Publication types
MeSH terms
Substances
LinkOut - more resources
Full Text Sources
Other Literature Sources
