

An antibody microarray analysis of serum cytokines in neurodegenerative Parkinsonian syndromes
- PMID: 23173604
- PMCID: PMC3539904
- DOI: 10.1186/1477-5956-10-71
An antibody microarray analysis of serum cytokines in neurodegenerative Parkinsonian syndromes
Abstract
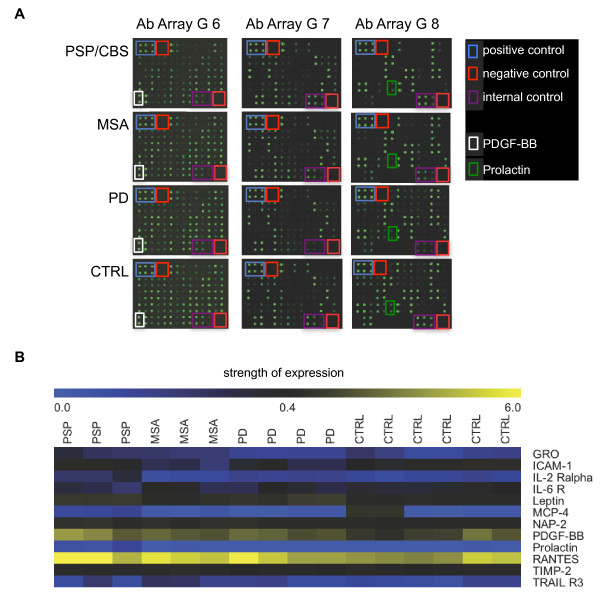
Background: Microarray technology may offer a new opportunity to gain insight into disease-specific global protein expression profiles. The present study was performed to apply a serum antibody microarray to screen for differentially regulated cytokines in Parkinson's disease (PD), multiple system atrophy (MSA), progressive supranuclear palsy (PSP) and corticobasal syndrome (CBS).
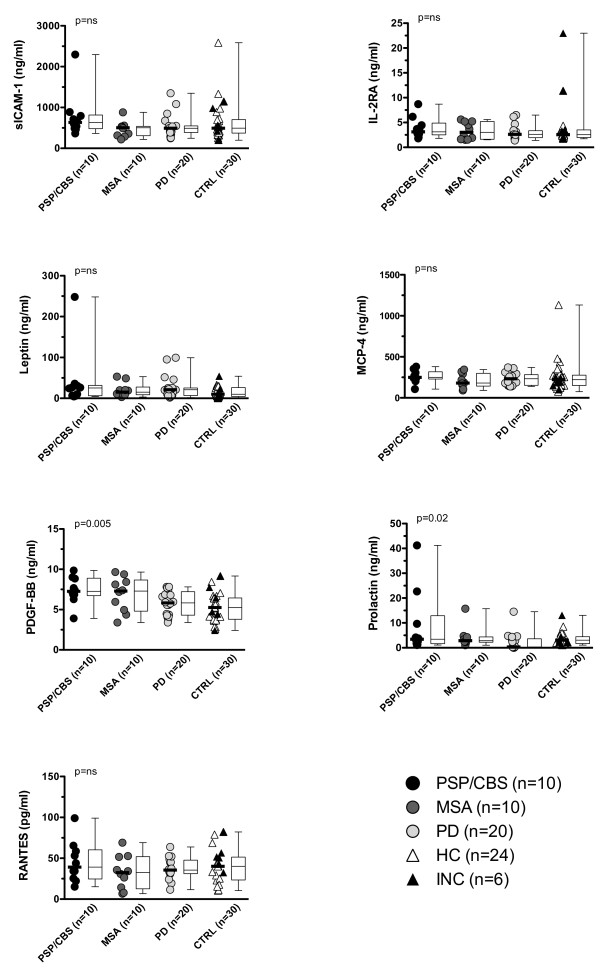
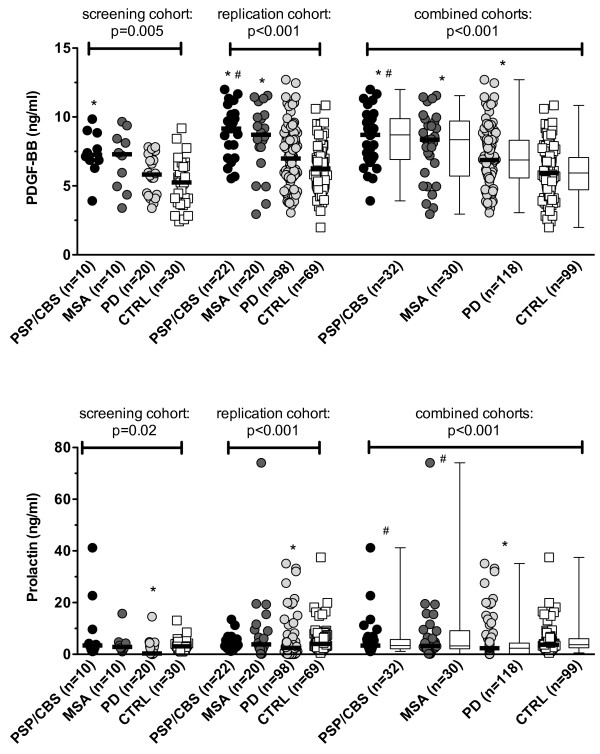
Results: Serum samples were obtained from patients with clinical diagnoses of PD (n = 117), MSA (n = 31) and PSP/CBS (n = 38) and 99 controls. Cytokine profiles of sera from patients and controls were analyzed with a semiquantitative human antibody array for 174 cytokines and the expression of 12 cytokines was found to be significantly altered. In a next step, results from the microarray experiment were individually validated by different immunoassays. Immunoassay validation confirmed a significant increase of median PDGF-BB levels in patients with PSP/CBS, MSA and PD and a decrease of median prolactin levels in PD. However, neither PDGF-BB nor prolactin were specific biomarkers to discriminate PSP/CBS, MSA, PD and controls.
Conclusions: In our unbiased cytokine array based screening approach and validation by a different immunoassay only two of 174 cytokines were significantly altered between patients and controls.
Figures
Similar articles
-
Cerebrospinal Fluid Levels of 5-Hydroxyindoleacetic Acid in Parkinson's Disease and Atypical Parkinsonian Syndromes.Neurodegener Dis. 2021;21(1-2):30-35. doi: 10.1159/000520302. Epub 2021 Oct 25. Neurodegener Dis. 2021. PMID: 34695830
-
Diagnosis Across the Spectrum of Progressive Supranuclear Palsy and Corticobasal Syndrome.JAMA Neurol. 2020 Mar 1;77(3):377-387. doi: 10.1001/jamaneurol.2019.4347. JAMA Neurol. 2020. PMID: 31860007 Free PMC article.
-
Cognitive and neuropsychiatric profiles distinguish atypical parkinsonian syndromes.Brain. 2025 Apr 16:awaf132. doi: 10.1093/brain/awaf132. Online ahead of print. Brain. 2025. PMID: 40238956
-
Comparison of autonomic dysfunction in patients with Parkinson's Disease, progressive supranuclear palsy, and multiple system atrophy.Neurol Neurochir Pol. 2024;58(2):193-202. doi: 10.5603/pjnns.96939. Epub 2023 Dec 27. Neurol Neurochir Pol. 2024. PMID: 38148738
-
Asymmetry in Atypical Parkinsonian Syndromes-A Review.J Clin Med. 2024 Sep 28;13(19):5798. doi: 10.3390/jcm13195798. J Clin Med. 2024. PMID: 39407856 Free PMC article. Review.
Cited by
-
Biomarker of Neuroinflammation in Parkinson's Disease.Int J Mol Sci. 2022 Apr 8;23(8):4148. doi: 10.3390/ijms23084148. Int J Mol Sci. 2022. PMID: 35456966 Free PMC article. Review.
-
Serum biomarker analysis in patients with recurrent spontaneous abortion.Mol Med Rep. 2017 Sep;16(3):2367-2378. doi: 10.3892/mmr.2017.6890. Epub 2017 Jun 30. Mol Med Rep. 2017. PMID: 28677727 Free PMC article.
-
Blood inflammation relates to neuroinflammation and survival in frontotemporal lobar degeneration.Brain. 2025 Feb 3;148(2):493-505. doi: 10.1093/brain/awae269. Brain. 2025. PMID: 39155063 Free PMC article.
-
Blood and Cerebrospinal Fluid Biomarkers of Inflammation in Parkinson's Disease.J Parkinsons Dis. 2022;12(s1):S183-S200. doi: 10.3233/JPD-223277. J Parkinsons Dis. 2022. PMID: 35661021 Free PMC article. Review.
-
Genetic and Transcriptomic Profiles of Inflammation in Neurodegenerative Diseases: Alzheimer, Parkinson, Creutzfeldt-Jakob and Tauopathies.Int J Mol Sci. 2016 Feb 4;17(2):206. doi: 10.3390/ijms17020206. Int J Mol Sci. 2016. PMID: 26861289 Free PMC article. Review.
References
Grants and funding
LinkOut - more resources
Full Text Sources
Miscellaneous
