

A metabolic signature for long life in the Caenorhabditis elegans Mit mutants
- PMID: 23173729
- PMCID: PMC3552119
- DOI: 10.1111/acel.12029
A metabolic signature for long life in the Caenorhabditis elegans Mit mutants
Abstract
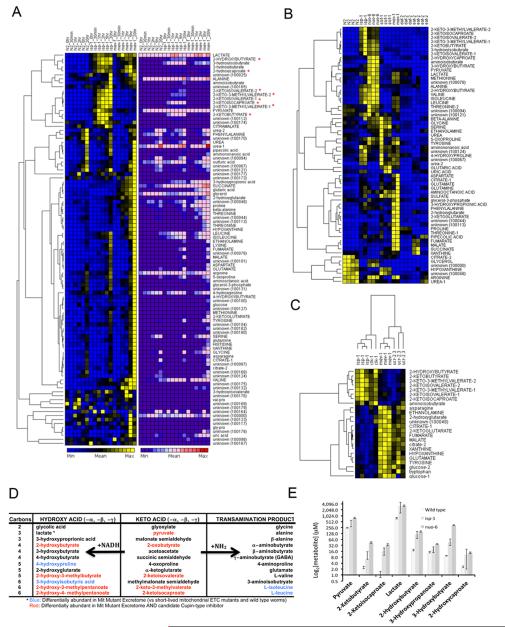
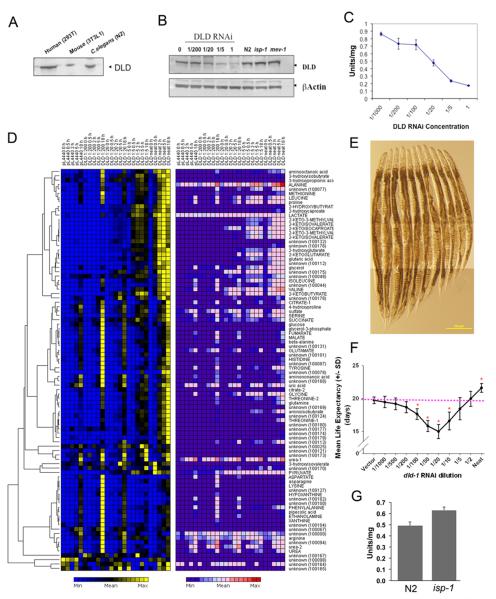
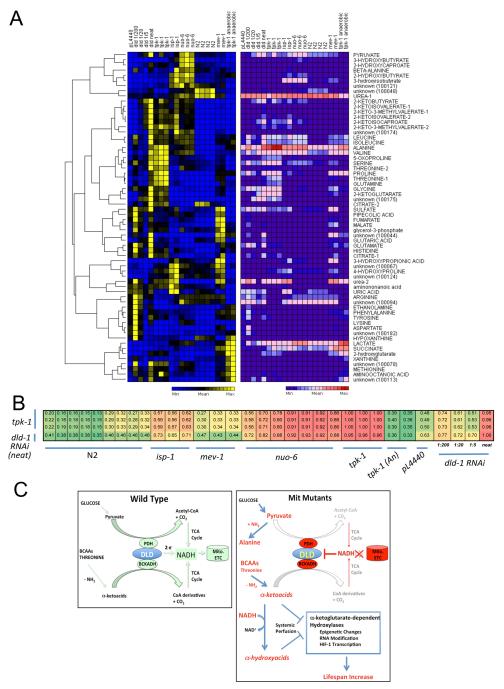
Mit mutations that disrupt function of the mitochondrial electron transport chain can, inexplicably, prolong Caenorhabditis elegans lifespan. In this study we use a metabolomics approach to identify an ensemble of mitochondrial-derived α-ketoacids and α-hydroxyacids that are produced by long-lived Mit mutants but not by other long-lived mutants or by short-lived mitochondrial mutants. We show that accumulation of these compounds is dependent on concerted inhibition of three α-ketoacid dehydrogenases that share dihydrolipoamide dehydrogenase (DLD) as a common subunit, a protein previously linked in humans with increased risk of Alzheimer's disease. When the expression of DLD in wild-type animals was reduced using RNA interference we observed an unprecedented effect on lifespan - as RNAi dosage was increased lifespan was significantly shortened, but, at higher doses, it was significantly lengthened, suggesting that DLD plays a unique role in modulating length of life. Our findings provide novel insight into the origin of the Mit phenotype.
© 2012 The Authors Aging Cell © 2012 Blackwell Publishing Ltd/Anatomical Society of Great Britain and Ireland.
Figures
Similar articles
-
Long-lived mitochondrial (Mit) mutants of Caenorhabditis elegans utilize a novel metabolism.FASEB J. 2010 Dec;24(12):4977-88. doi: 10.1096/fj.10-162941. Epub 2010 Aug 23. FASEB J. 2010. PMID: 20732954 Free PMC article.
-
Lifespan extension by suppression of autophagy genes in Caenorhabditis elegans.Genes Cells. 2009 Jun;14(6):717-26. doi: 10.1111/j.1365-2443.2009.01306.x. Epub 2009 May 14. Genes Cells. 2009. PMID: 19469880
-
Succinate dehydrogenase upregulation destabilize complex I and limits the lifespan of gas-1 mutant.PLoS One. 2013;8(3):e59493. doi: 10.1371/journal.pone.0059493. Epub 2013 Mar 28. PLoS One. 2013. PMID: 23555681 Free PMC article.
-
Mitochondrial respiration and reactive oxygen species in C. elegans.Exp Gerontol. 2006 Oct;41(10):957-67. doi: 10.1016/j.exger.2006.06.056. Epub 2006 Aug 21. Exp Gerontol. 2006. PMID: 16919906 Review.
-
Effects of the mitochondrial respiratory chain on longevity in C. elegans.Exp Gerontol. 2014 Aug;56:245-55. doi: 10.1016/j.exger.2014.03.028. Epub 2014 Apr 5. Exp Gerontol. 2014. PMID: 24709342 Review.
Cited by
-
Targeting metabolic pathways for extension of lifespan and healthspan across multiple species.Ageing Res Rev. 2020 Dec;64:101188. doi: 10.1016/j.arr.2020.101188. Epub 2020 Oct 5. Ageing Res Rev. 2020. PMID: 33031925 Free PMC article. Review.
-
Small-Scale Colorimetric Assays of Intracellular Lactate and Pyruvate in the Nematode Caenorhabditis elegans.J Vis Exp. 2018 Oct 15;(140):57807. doi: 10.3791/57807. J Vis Exp. 2018. PMID: 30371679 Free PMC article.
-
Tether mutations that restore function and suppress pleiotropic phenotypes of the C. elegans isp-1(qm150) Rieske iron-sulfur protein.Proc Natl Acad Sci U S A. 2015 Nov 10;112(45):E6148-57. doi: 10.1073/pnas.1509416112. Epub 2015 Oct 26. Proc Natl Acad Sci U S A. 2015. PMID: 26504246 Free PMC article.
-
A Mutation in Caenorhabditis elegans NDUF-7 Activates the Mitochondrial Stress Response and Prolongs Lifespan via ROS and CED-4.G3 (Bethesda). 2015 Jun 1;5(8):1639-48. doi: 10.1534/g3.115.018598. G3 (Bethesda). 2015. PMID: 26038366 Free PMC article.
-
Isocitrate Dehydrogenase Alpha-1 Modulates Lifespan and Oxidative Stress Tolerance in Caenorhabditis elegans.Int J Mol Sci. 2022 Dec 29;24(1):612. doi: 10.3390/ijms24010612. Int J Mol Sci. 2022. PMID: 36614054 Free PMC article.
References
-
- Benard C, McCright B, Zhang Y, Felkai S, Lakowski B, Hekimi S. The C. elegans maternal-effect gene clk-2 is essential for embryonic development, encodes a protein homologous to yeast Tel2p and affects telomere length. Development. 2001;128:4045–4055. - PubMed
-
- Broeckling CD, Reddy IR, Duran AL, Zhao X, Sumner LW. MET-IDEA: data extraction tool for mass spectrometry-based metabolomics. Anal Chem. 2006;78:4334–4341. - PubMed
-
- Brown AM, Gordon D, Lee H, Caudy M, Hardy J, Haroutunian V, Blass JP. Association of the dihydrolipoamide dehydrogenase gene with Alzheimer’s disease in an Ashkenazi Jewish population. Am J Med Genet B Neuropsychiatr Genet. 2004;131B:60–66. - PubMed
Publication types
MeSH terms
Substances
Grants and funding
LinkOut - more resources
Full Text Sources
Other Literature Sources
Research Materials
Miscellaneous
