

Use of a whole-slide imaging system to assess the presence and alteration of lymphatic vessels in joint sections of arthritic mice
- PMID: 23173750
- PMCID: PMC3672261
- DOI: 10.3109/10520295.2012.729864
Use of a whole-slide imaging system to assess the presence and alteration of lymphatic vessels in joint sections of arthritic mice
Abstract
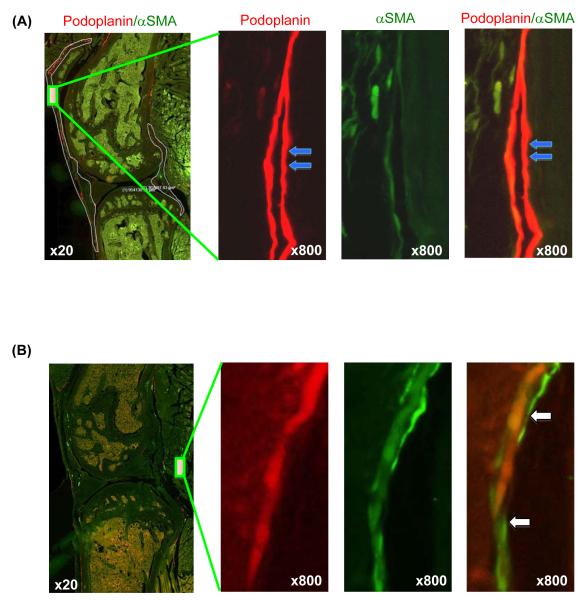
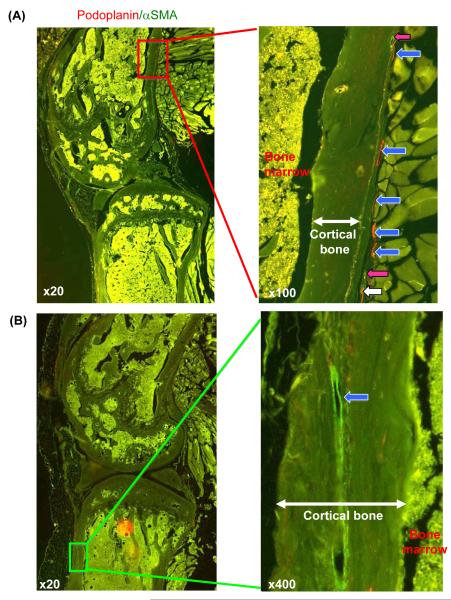
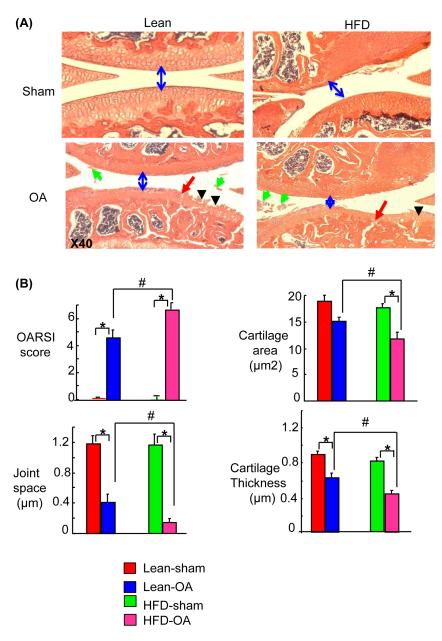
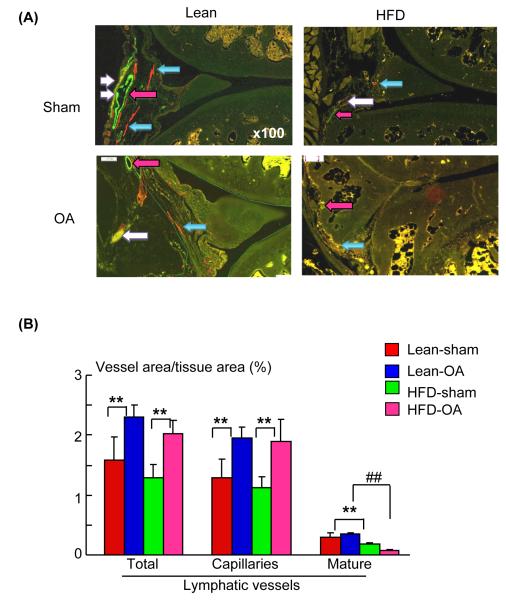
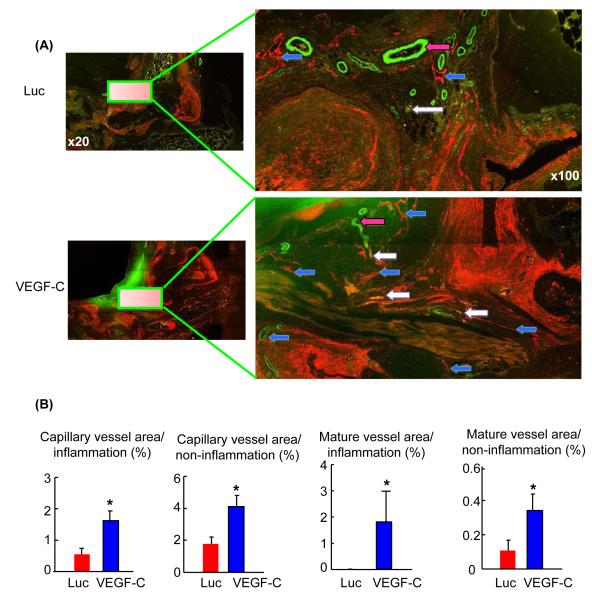
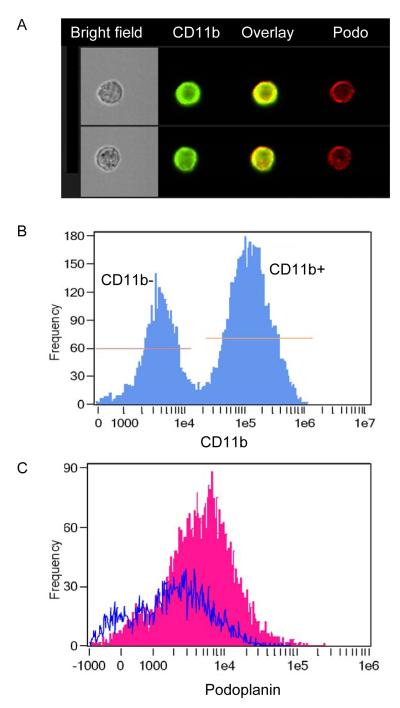
We investigated the presence and alteration of lymphatic vessels in joints of arthritic mice using a whole-slide imaging system. Joints and long bone sections were cut from paraffin blocks of two mouse models of arthritis: meniscal-ligamentous injury (MLI)-induced osteoarthritis (OA) and TNF transgene (TNF-Tg)-induced rheumatoid arthritis (RA). MLI-OA mice were fed a high fat diet to accelerate OA development. TNF-Tg mice were treated with lymphatic growth factor VEGF-C virus to stimulate lymphangiogenesis. Sections were double immunofluorescence stained with anti-podoplanin and alpha-smooth muscle actin antibodies. The area and number of lymphatic capillaries and mature lymphatic vessels were determined using a whole-slide imaging system and its associated software. Lymphatic vessels in joints were distributed in soft tissues mainly around the joint capsule, ligaments, fat pads and muscles. In long bones, enriched lymphatic vessels were present in the periosteal areas adjacent to the blood vessels. Occasionally, lymphatic vessels were observed in the cortical bone. Increased lymphatic capillaries, but decreased mature lymphatic vessels, were detected in both OA and RA joints. VEGF-C treatment increased lymphatic capillary and mature vessel formation in RA joints. Our findings suggest that the lymphatic system may play an important role in arthritis pathogenesis and treatment.
Figures
Similar articles
-
Lymphatic vessels: roles and potential therapeutic intervention in rheumatoid arthritis and osteoarthritis.Theranostics. 2024 Jan 1;14(1):265-282. doi: 10.7150/thno.90940. eCollection 2024. Theranostics. 2024. PMID: 38164153 Free PMC article. Review.
-
Distribution and alteration of lymphatic vessels in knee joints of normal and osteoarthritic mice.Arthritis Rheumatol. 2014 Mar;66(3):657-66. doi: 10.1002/art.38278. Arthritis Rheumatol. 2014. PMID: 24574226 Free PMC article.
-
Vascular endothelial growth factor C attenuates joint damage in chronic inflammatory arthritis by accelerating local lymphatic drainage in mice.Arthritis Rheum. 2011 Aug;63(8):2318-28. doi: 10.1002/art.30421. Arthritis Rheum. 2011. PMID: 21538325 Free PMC article.
-
Peri-articular lymphatic system and "Bi" theory of Chinese medicine in the pathogenesis and treatment of arthritis.Chin J Integr Med. 2015 Sep;21(9):648-55. doi: 10.1007/s11655-015-2305-0. Epub 2015 Oct 3. Chin J Integr Med. 2015. PMID: 26432788 Free PMC article. Review.
-
Single-cell transcriptomics of popliteal lymphatic vessels and peripheral veins reveals altered lymphatic muscle and immune cell populations in the TNF-Tg arthritis model.Arthritis Res Ther. 2022 Mar 7;24(1):64. doi: 10.1186/s13075-022-02730-z. Arthritis Res Ther. 2022. PMID: 35255954 Free PMC article.
Cited by
-
Lymphatic vessels: roles and potential therapeutic intervention in rheumatoid arthritis and osteoarthritis.Theranostics. 2024 Jan 1;14(1):265-282. doi: 10.7150/thno.90940. eCollection 2024. Theranostics. 2024. PMID: 38164153 Free PMC article. Review.
-
Effect of Human Synovial Fluid From Osteoarthritis Patients and Healthy Individuals on Lymphatic Contractile Activity.J Biomech Eng. 2022 Jul 1;144(7):071012. doi: 10.1115/1.4053749. J Biomech Eng. 2022. PMID: 35118490 Free PMC article.
-
Fang-Ji-Huang-Qi-Tang Attenuates Degeneration of Early-Stage KOA Mice Related to Promoting Joint Lymphatic Drainage Function.Evid Based Complement Alternat Med. 2020 Mar 20;2020:3471681. doi: 10.1155/2020/3471681. eCollection 2020. Evid Based Complement Alternat Med. 2020. PMID: 32280355 Free PMC article.
-
Current understanding of osteoarthritis pathogenesis and relevant new approaches.Bone Res. 2022 Sep 20;10(1):60. doi: 10.1038/s41413-022-00226-9. Bone Res. 2022. PMID: 36127328 Free PMC article. Review.
-
The Intraosseous Dysfunction in the Osteopathic Perspective: Mechanisms Implicating the Bone Tissue.Cureus. 2020 Jan 24;12(1):e6760. doi: 10.7759/cureus.6760. Cureus. 2020. PMID: 32140328 Free PMC article. Review.
References
-
- Adams RH, Alitalo K. Molecular regulation of angiogenesis and lymphangiogenesis. Nat. Rev. Mol. Cell Biol. 2007;8:464–478. - PubMed
-
- Bergman MJ. Social and economic impact of inflammatory arthritis. Postgrad. Med. 2006;Spec. No: 5-11 [Q7] - PubMed
-
- Boyce BF. Bone biopsy and histomorphometry in metabolic bone disease. In: Stevenson JC, editor. NewTechniques in Metabolic Bone Disease. Butterworths; London: 1990. pp. 110–131.
-
- Edwards JR, Williams K, Kindblom LG, Meis-Kindblom JM, Hogendoorn PC, Hughes D, Forsyth RG, Jackson D, Athanasou NA. Lymphatics and bone. Hum. Pathol. 2008;39:49–55. - PubMed
Publication types
MeSH terms
Grants and funding
LinkOut - more resources
Full Text Sources
Medical
Miscellaneous