. 2013 Feb;124(4):466-77.
doi: 10.1111/jnc.12100. Epub 2012 Dec 26.

RACK1 identified as the PCBP1-interacting protein with a novel functional role on the regulation of human MOR gene expression

Affiliations

RACK1 identified as the PCBP1-interacting protein with a novel functional role on the regulation of human MOR gene expression

Pranjal Nahar-Gohad et al. J Neurochem. 2013 Feb.

Abstract

Poly C binding protein 1 (PCBP1) is an expressional regulator of the mu-opioid receptor (MOR) gene. We hypothesized the existence of a PCBP1 co-regulator modifying human MOR gene expression by protein-protein interaction with PCBP1. A human brain cDNA library was screened using the two-hybrid system with PCBP1 as the bait. Receptor for activated protein kinase C (RACK1) protein, containing seven WD domains, was identified. PCBP1-RACK1 interaction was confirmed via in vivo validation using the two-hybrid system, and by co-immunoprecipitation with anti-PCBP1 antibody and human neuronal NMB cell lysate, endogenously expressing PCBP1 and RACK1. Further co-immunoprecipitation suggested that RACK1-PCBP1 interaction occurred in cytosol alone. Single and serial WD domain deletion analyses demonstrated that WD7 of RACK1 is the key domain interacting with PCBP1. RACK1 over-expression resulted in a dose-dependent decrease of MOR promoter activity using p357 plasmid containing human MOR promoter and luciferase reporter gene. Knock-down analysis showed that RACK1 siRNA decreased the endogenous RACK1 mRNA level in NMB, and elevated MOR mRNA level as indicated by RT-PCR. Likewise, a decrease of RACK1 resulted in an increase of MOR proteins, verified by (3) H-diprenorphine binding assay. Collectively, this study reports a novel role of RACK1, physically interacting with PCBP1 and participating in the regulation of human MOR gene expression in neuronal NMB cells.


Conflict of interest statement

The authors declare no conflict of interest.

Figures

Fig. 1
Fig. 1. Cellular distribution of RACK1 in NMB cells
(A) Investigation of endogenous expression of PCBP1 and RACK1 in human NMB cells. Cell lysates from NMB cells were subjected to SDS-PAGE and then Western blot analysis with anti-PCBP1 antibody from (lane 1). The same blot was then probed with anti-RACK1 antibody (lane 2) without stripping off the PCBP1 signal. Both antibodies were purchased from Santa Cruz biotechnology. Arrows indicated the specific PCBP1 and RACK1 signals, individually. The positions of protein markers (31 and 38 kDa) are indicated on the left. (B) Examination of the intracellular localization of RACK1 using confocal microscopy analysis under 40x or 60x magnification of the objective lens. NMB cells were fixed with paraformaldehyde and then perforated with Triton X-100. RACK1 was stained using anti-RACK1 antibody, and then probed with the secondary Cy3-labeled anti-IgG antibody (indicated by orange color). Nucleus was stained with DAPI (blue color). RACK1 has prominent cytosolic distribution with some punctated nuclear staining (indicated by arrows) as shown in merged images. (C) Immunoblot analysis of RACK1 expression in the nucleus of NMB cell. Western blot analysis was performed using anti-RACK1 antibody with equivalent amounts of proteins from whole cell lysates (lane 1) or nuclear extracts (lane 2). RACK1 was found in the nucleus extract, demonstrating its nuclear localization, collaborating with the confocal data. (D) Histograms show the quantitative results from three different Western blot analyses with the RACK1 amount from whole cell lysates arbitrarily defined as 100%. Data are presented as mean ± SE. Asterisk “*” indicates p < 0.001 (t-test).
Fig. 2
Fig. 2. Co-immunoprecipitation of PCBP1-RACK1 using NMB lysates
(A) Whole cell lysates from NMB cells were incubated with anti-PCBP1 (lane 2) or non-specific anti-IgG antibodies (lane 1, as a negative control). Lane 3, indicated as “input”, is whole cell lysate alone. Subsequently, immunoprecipitants were purified by anti-IgG beads. The immunoprecipitants were subjected to SDS-PAGE and then Western blot analysis using anti-PCBP1 antibody to validate the successful pull-down of PCBP1 (indicated by an arrow). (B) The same blot was then probed with anti-RACK1 antibody, without stripping PCBP1 signals. Western blot analysis showed that anti-PCBP1 antibody successfully co-immunoprecipitated RACK1 in lane 2, whereas no RACK1 band was detected in the control IgG sample (lane 1). (C) Nuclear extracts from NMB cells were incubated with anti-PCBP1 (indicated as NE) or non-specific anti-IgG antibodies (C as a negative control). Simultaneously, whole cell lysate was also incubated with anti-PCBP1 (indicated as cell lysate) for the purpose of comparison. Subsequently, immunoprecipitants were purified by anti-IgG beads and further subjected to SDS-PAGE and Western blot analysis using anti-PCBP1 and anti-RACK1 antibody. The RACK1 and PCBP1 signals are indicated by arrows, respectively.
Fig. 3
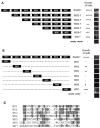
Fig. 3. Mapping RACK1-PCBP1 interaction domain using the serial and single RACK1 WD domain deletional analyses
(A) Diagrams on the left illustrate the full-length of RACK1 (indicated as RACK1) and sequentially truncated RACK1 (WD2-7, 3-7, 4-7, 5-7, 6-7 and 7). Each fragment was cloned into pTRG vector. Each construct was cotransformed with the full-length PCBP1 (pBT-PCBP1) plasmid using the bacteria two-hybrid system. The blank vector, pTRG (indicated as empty vector), was also used simultaneously as a negative control. Transformants were subjected to the selection medium containing tetracycline, chloramphenicol, 3-amino-1,2,4-trizol (3AT) and streptomycin. Interaction between RACK1 and PCBP1 was assessed by the growth ability (indicated by + sign), with the growth of the full length of RACK1 and PCBP1 arbitrarily designed as “+++++”. Similar results were obtained in three different tests. (B) Diagrams on the left illustrate the full-length of RACK1 (RACK1) and individual WD domain of RACK1 constructs (WD2, 3, 4, 5, 6 and 7). Each fragment was cloned into the pTRG vector. The blank vector pTRG (indicated as empty vector) was used as a negative control. Interaction capability between RACK1 and PCBP1 was determined by the growth of transformants using the two-hybrid system. WD 7 construct exhibited the strongest growth among all individual WD constructs, similar to that of the full-length of RACK1 construct. Similar results were obtained from three different tests. (C) Amino acid sequence comparison of all WD domains of RACK1 protein. Conserved amino acids are shaded. WD 6 and 7 domains are more diverged from the other WD domains.
Fig. 4
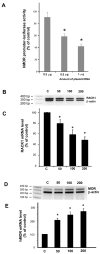
Fig. 4. Effect of RACK1 overexpression on the promoter activity of human MOR gene and the impact of RACK 1 siRNA knock-down on RACK1 and hMOR mRNA levels
(A) NMB cells were transiently transfected with different amounts of pcDNA3-RACK1 (gray bars) or pcDNA3 vector (as the control) along with p357 plasmid, containing the human MOR (hMOR) active promoter in the luciferase reporter pGL3-basic vector. The pCH110 plasmid, containing the β-galactosidase, was also transfected simultaneously, and its activity was used as the internal standard for normalization purpose. Forty eight hrs after transfection, luciferase activity was determined. Activities from control samples (transfected with pcDNA3 blank vector) were defined as 100%. Histograms represent mean ± SE from 4 different experiments. Asterisk “*” indicates p < 0.001 (t-test). (B) NMB cells were transfected with control (indicated as C) or RACK1 siRNA. Forty eight hrs after transfection, RNA was extracted from transfected cells. RT-PCR was performed using a pair of primers specific to human RACK1. The β-actin specific primers were also included in every PCR reaction as the internal control for normalization. PCR products were analyzed using gel electrophoresis and then were quantified. (C) Quantitation of normalized RACK1 mRNA levels is shown, with RACK1 mRNA level from the control sample as 100%. Histograms represent mean ± SE from 5 different experiments. Asterisk “*” indicates p < 0.001 (t-test). (D) Up-regulation of hMOR mRNA level by RACK1 knockdown. NMB cells were transfected with control (indicated as C) or RACK1 siRNA. Forty eight hrs after transfection, RNA was extracted from transfected cells, and RT-PCR was performed using a pair of primers specific to human MOR. The human β-actin specific primers were also included in every PCR reaction as the internal control for normalization. PCR products were analyzed and quantified. (E) Histograms show the quantitative data of the normalized hMOR mRNA level. The hMOR mRNA level from control sample was defined as 100%. Data represented as mean ± SE from 5 different experiments. Asterisk “*” indicates p < 0.001 (t-test).
Fig. 5
Fig. 5. Impact of RACK1 knock-down on the endogenous RACK1 and PCBP1 mRNA and protein levels at 72 hrs after transfection
(A) NMB cells were transfected with 200 nM RACK1 or control (C). Seventy two hrs after transfection, RNA was extracted from transfected cells, and RT-PCR was performed using a pair of primers specific to human RACK1. Human β-actin primers were also included in every PCR reaction as the internal control for normalization. PCR products were separated using gel electrophoresis. (B) Western blot analysis of the level of endogenous RACK1 protein using anti-RACK1 antibody with the same amount of proteins from cell lysates of the control or RACK1 siRNA transfected cells. Human anti-β-actin antibody was also employed, and its signal was used for normalization purpose. Quantitative data of normalized RACK1 protein level is shown using histogram with the RACK1 protein level from the control samples as 100%. Histograms represent mean ± SE from 6 different experiments. Asterisk “*” indicates p < 0.001 (t-test). (C) No change of endogenous PCBP1 level in cells with RACK1 knock-down at 72 hrs after transfection. NMB cells were transfected with 200 nM RACK1 siRNA or control (C). Seventy two hrs after transfection, RNAs were extracted from control and transfected cells, respectively. RT-PCR was performed using a pair of primers specific to human PCBP1 along with human β-actin primers included in every PCR reaction for normalization usage. PCR products were separated using gel electrophoresis. (D) Western blot analysis of the endogenous PCBP1 protein level using anti-PCBP1 antibody was performed with equal amounts of proteins from cell lysates of control or RACK1 siRNA treated cells. Human anti-β-tubulin antibody was also carried out, and its signal was used for normalization purpose. Quantitative data of normalized PCBP1 protein level is shown using the histogram with PCBP1 protein level of control as 100%. Histograms represent mean ± SE from 5 different experiments.
Fig. 6
Fig. 6. Increase of hMOR protein level in RACK1 knockdown cells and a schematic diagram representing RACK1 and PCBP1 interaction and its functional role on MOR gene expression in neuronal cells
(A) NMB cells were transfected with 200 nM RACK1 siRNA or control (C). Seventy two hrs after transfection, RNA was extracted from transfected cells, and RT-PCR was performed using a pair of primers specific to human MOR. Human β-actin specific primers were included in every PCR reaction for normalization. PCR products were separated and analyzed. (B) The hMOR protein level was determined using receptor-ligand binding assay with 2 nM [3H]-diprenorphine as the labeled ligand and 1 μM of CTAP as the competitive ligand. To block delta and kappa opioid receptors bindings, 1 μM of DADLE and U50488, respectively, were also included in all reactions. NMB cells transfected with control or RACK1 siRNA were harvested at 72 hrs after transfection for the competitive binding assay. Specific binding was defined as the difference between samples in the absence and presence of 1 μM CTAP. Specific [3H]-diprenorphine binding from the control sample was defined as 100%. The binding was normalized for equivalent amount of proteins. Histograms of binding correspond to mean ± SE calculated from three independent experiments and asterisk “*” indicates p < 0.001 (t-test). (C) This simplified diagram is centered with the dynamic equilibrium of RACK1 ( formula image) and PCBP1 ( formula image) on the left-hand side as well as its product of RACK1-PCBP1 complex on the right-hand side. PCBP1 in the free form enters the nucleus and activates the MOR gene transcription (as depicted in 1). When the equilibrium is shifted to right (more RACK1-PCBP1 complexes are formed) via the RACK1 overexpression, the concentration of free PCBP1 is reduced, so less is available to enter the nucleus, and thus the MOR gene expression is reduced. Conversely, when the availability of RACK1 is reduced by RACK1 siRNA knock down, the equilibrium is shifted to the left (less RACK1-PCBP complex was formed), and thus the concentration of free form of PCBP1 increases, and the MOR gene expression is enhanced at both transcription level (as depicted in 4) and the protein level (as depicted in 5 and 6).

Similar articles

Cited by

References

    1. Battaini F, Pascale A, Paoletti R, Govoni S. The role of anchoring protein rack1 in pkc activation in the ageing rat brain. Trends in Neurosci. 1997;20:410–415. - PubMed
    1. Baumhaker Y, Ben-Dor T, Bar-Hamburger R, Sarne Y. Characterization of a triple opioid system in the human neuroblastoma NMB cell line. Brain Res. 1994;665:94–100. - PubMed
    1. Berry AM, Flock KE, Loh HH, Ko JL. Molecular basis of cellular localization of poly C binding protein 1 in neuronal cells. Biochem Biophys Res Commun. 2006;349:1378–1386. - PMC - PubMed
    1. Buensuceso CS, Woodside D, Huff JL, Plopper GE, O’Toole TE. The WD protein Rack1 mediates protein kinase C and integrin-dependent cell migration. J Cell Sci. 2001;114:1691–1698. - PubMed
    1. Chang BY, Conroy KB, Machleder EM, Cartwright CA. RACK1, a receptor for activated C kinase and a homolog of the beta subunit of G proteins, inhibits activity of src tyrosine kinases and growth of NIH 3T3 cells. Mol Cell Biol. 1998;18:3245–3256. - PMC - PubMed

Publication types

MeSH terms