. 2013 Feb:93:4-24.
doi: 10.1016/j.beproc.2012.11.003. Epub 2012 Nov 19.

Functional relationships for investigating cognitive processes

Affiliations

Functional relationships for investigating cognitive processes

Anthony A Wright. Behav Processes. 2013 Feb.

Abstract

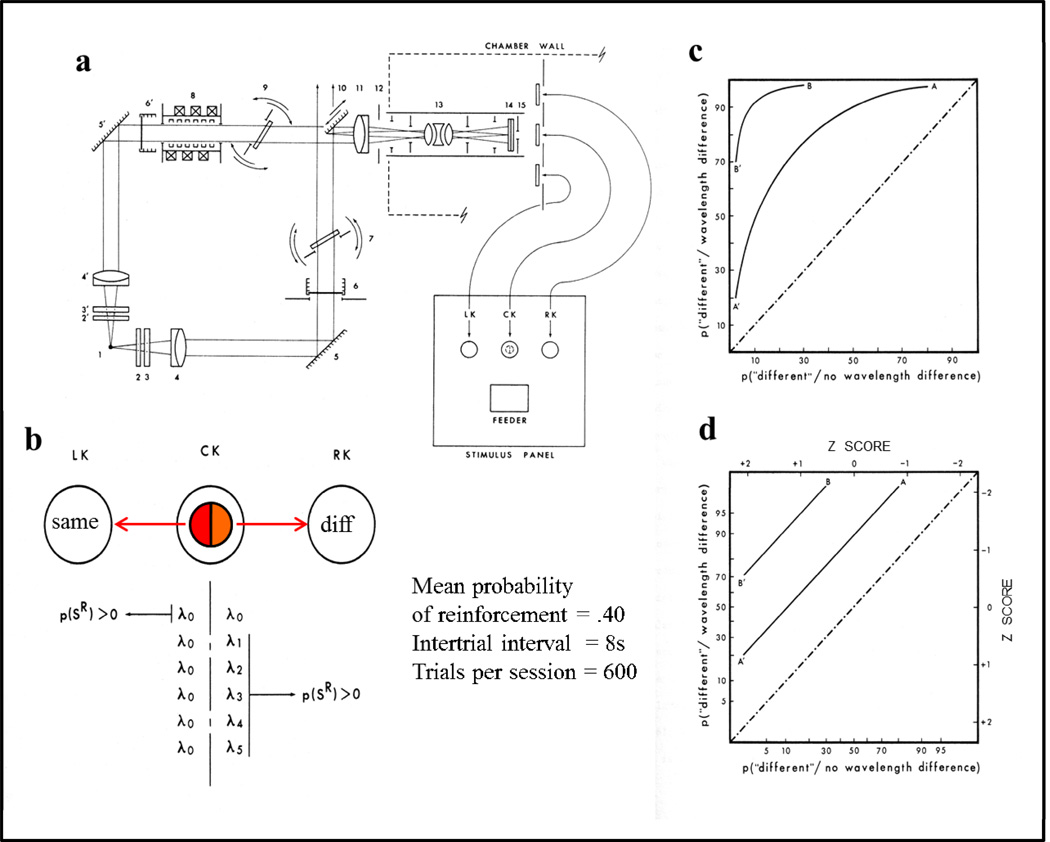
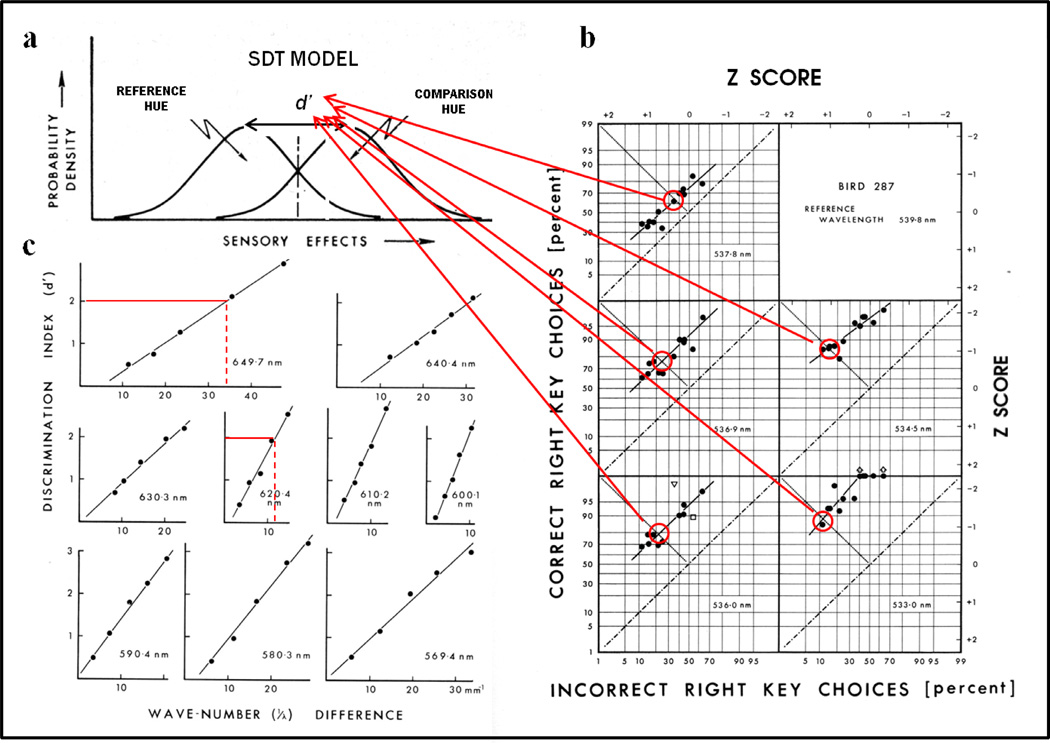
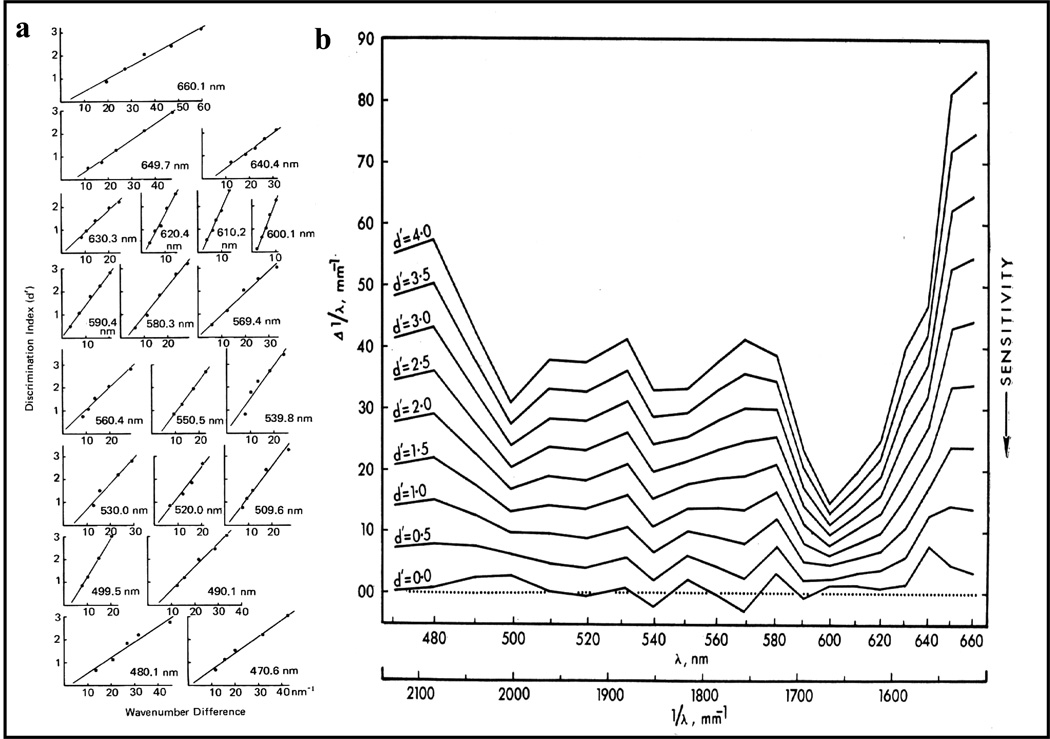
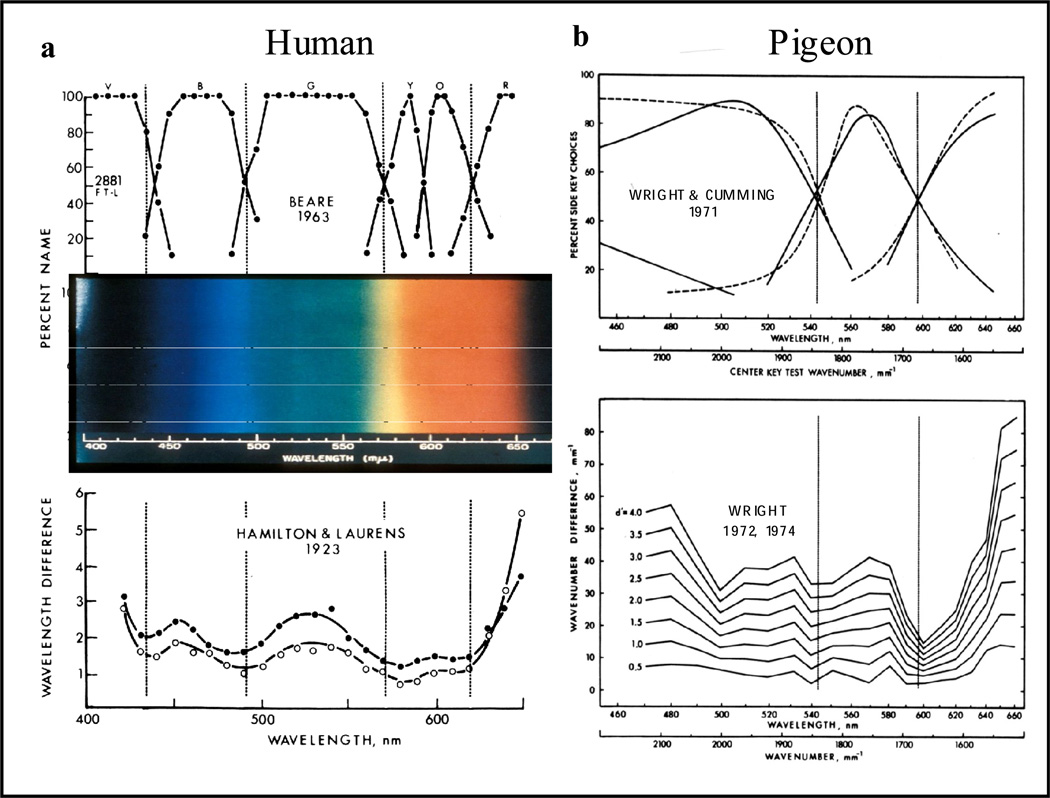
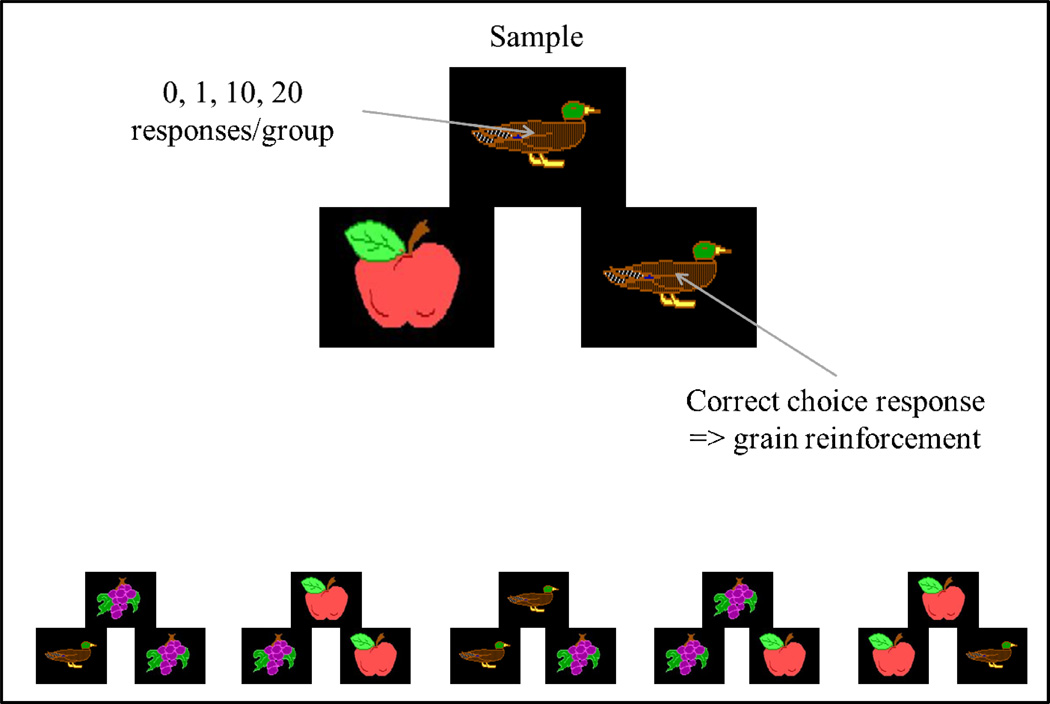
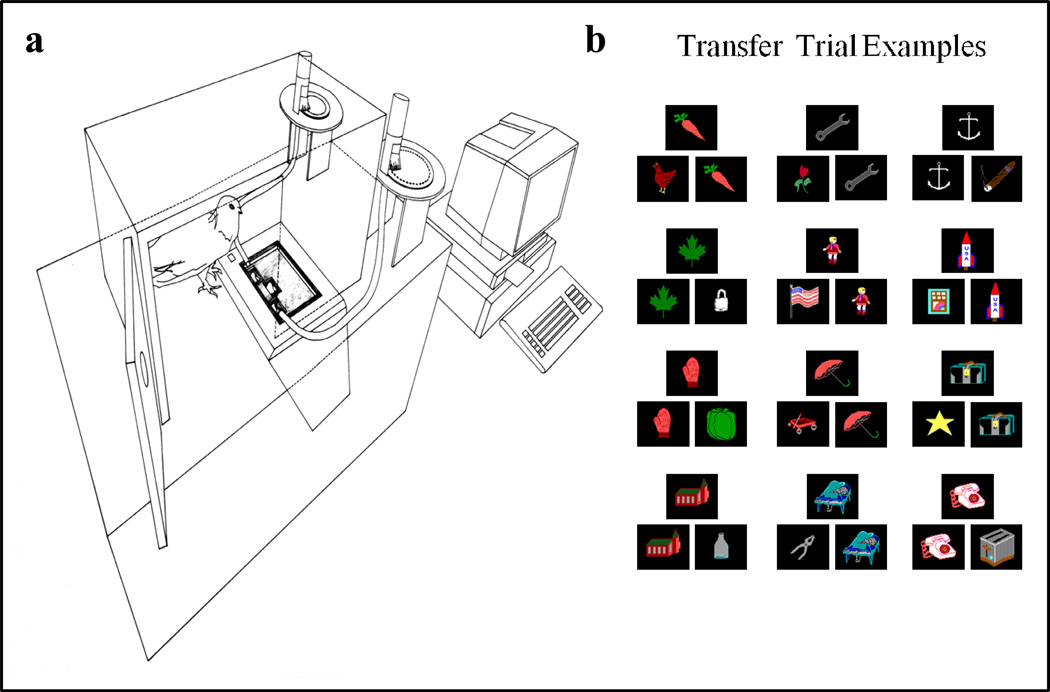
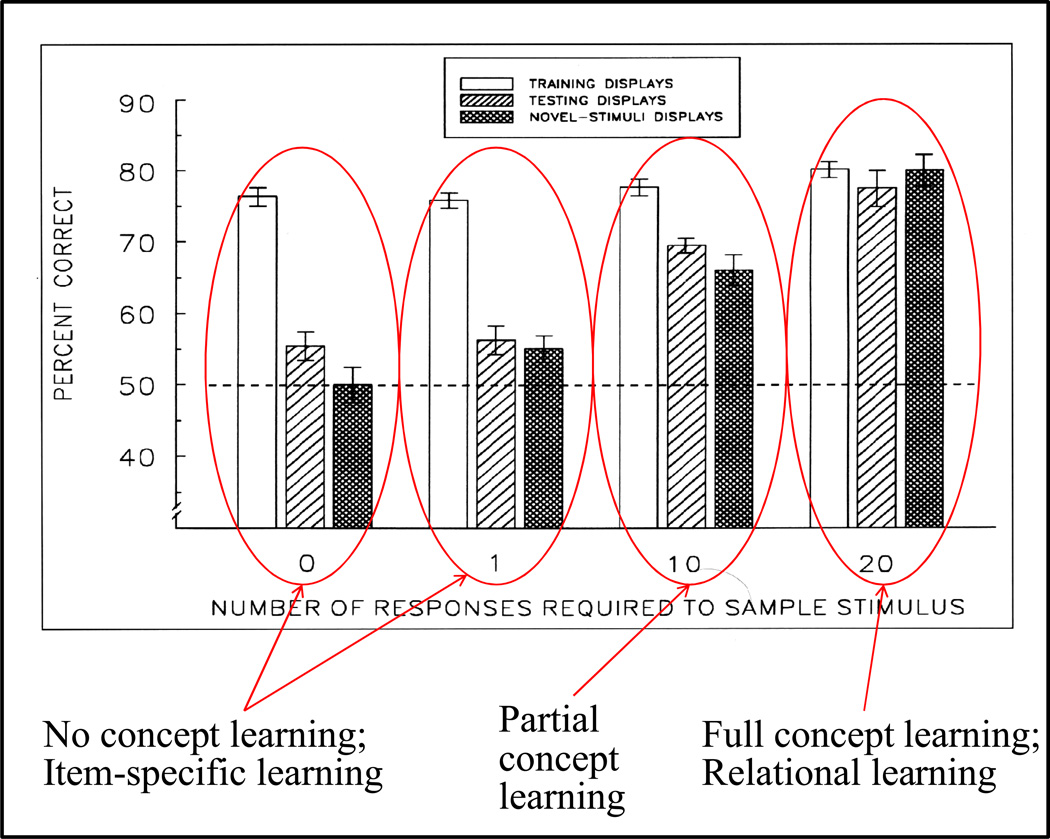
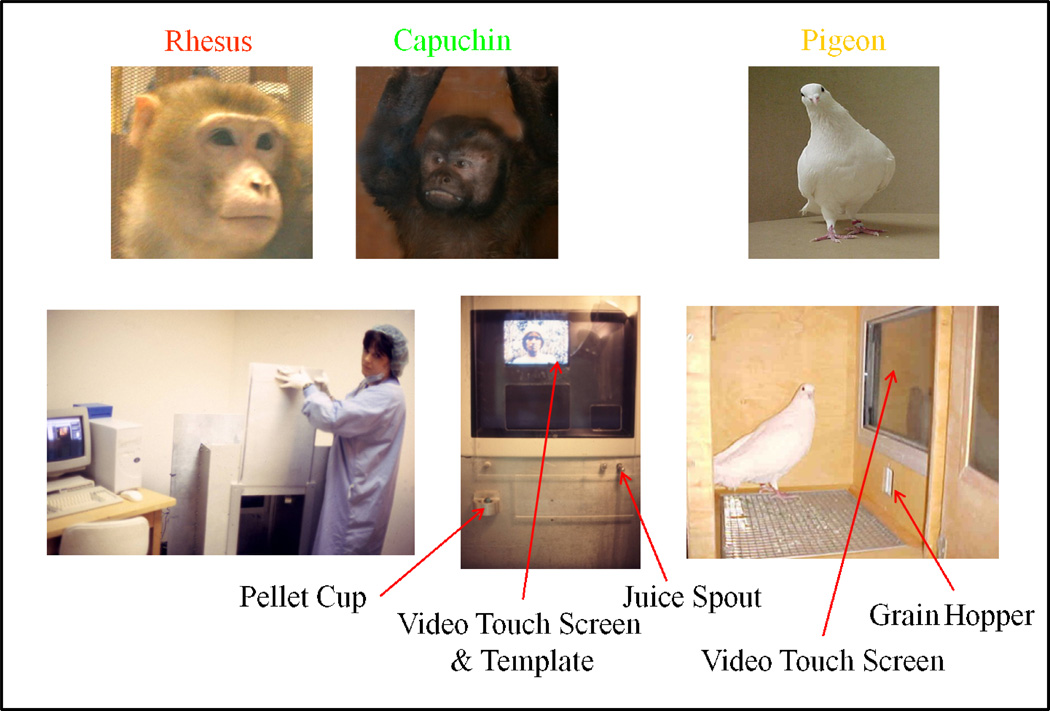
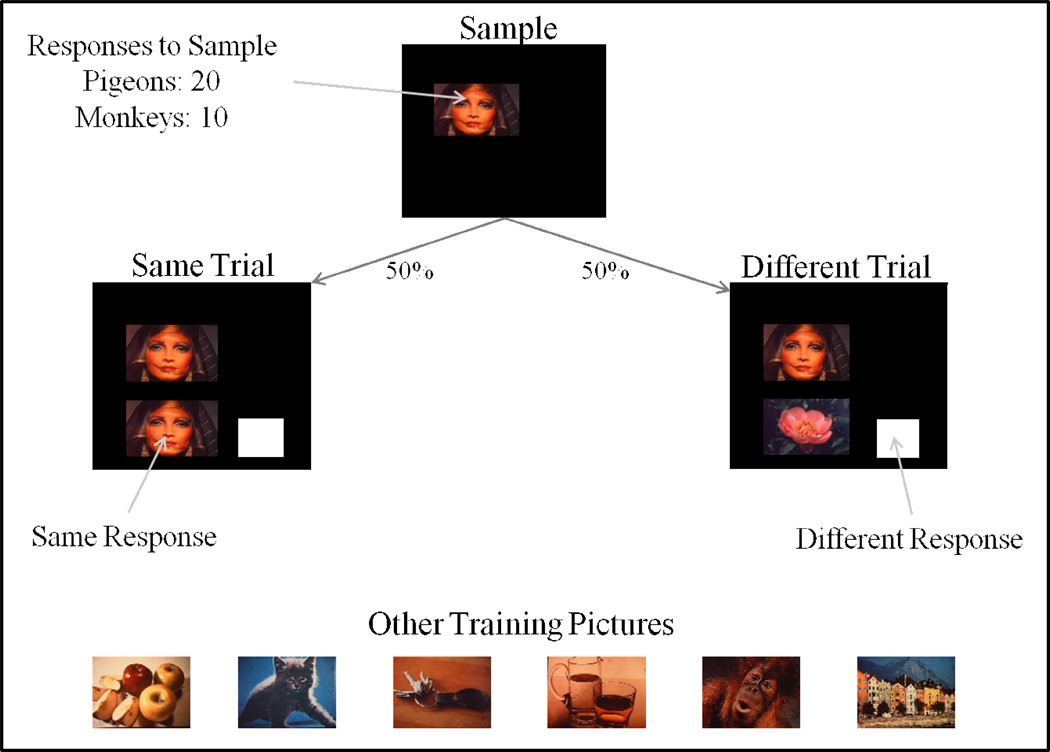
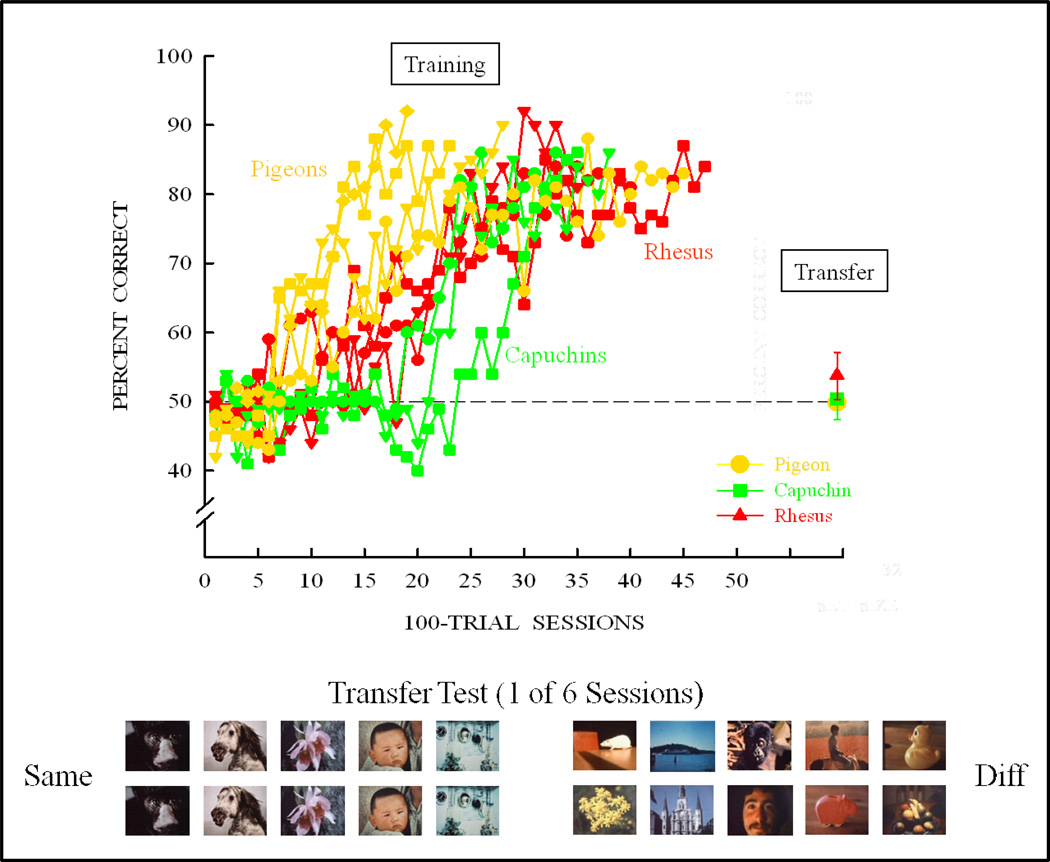
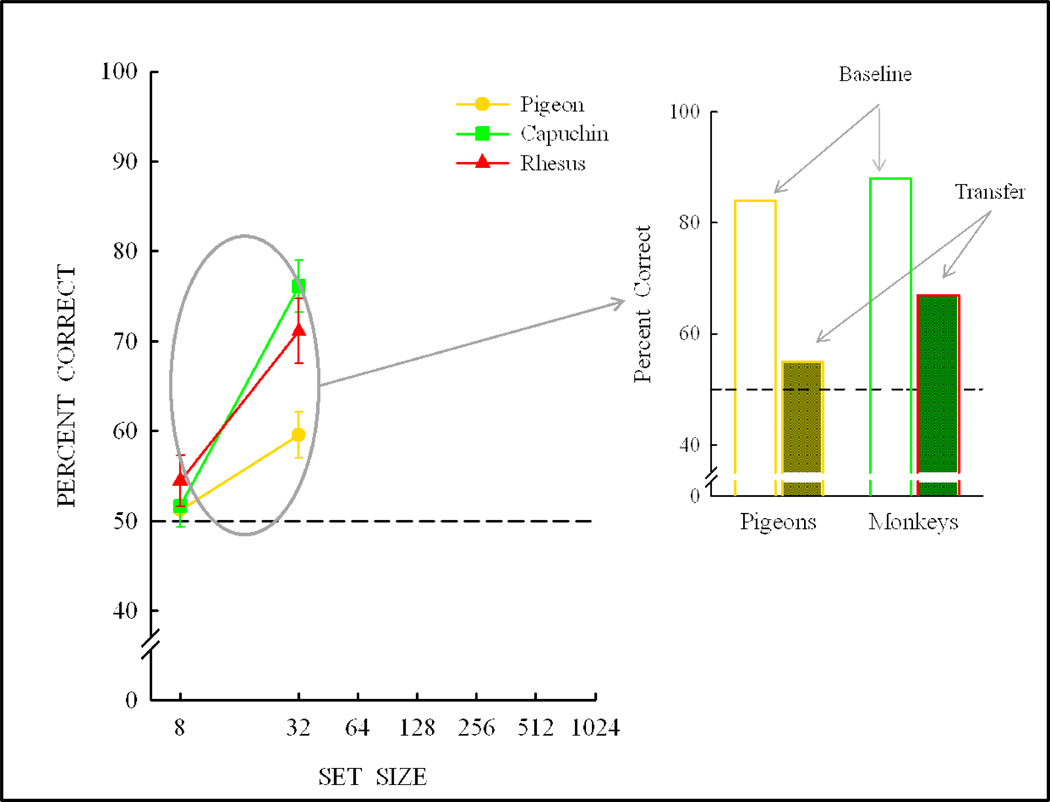
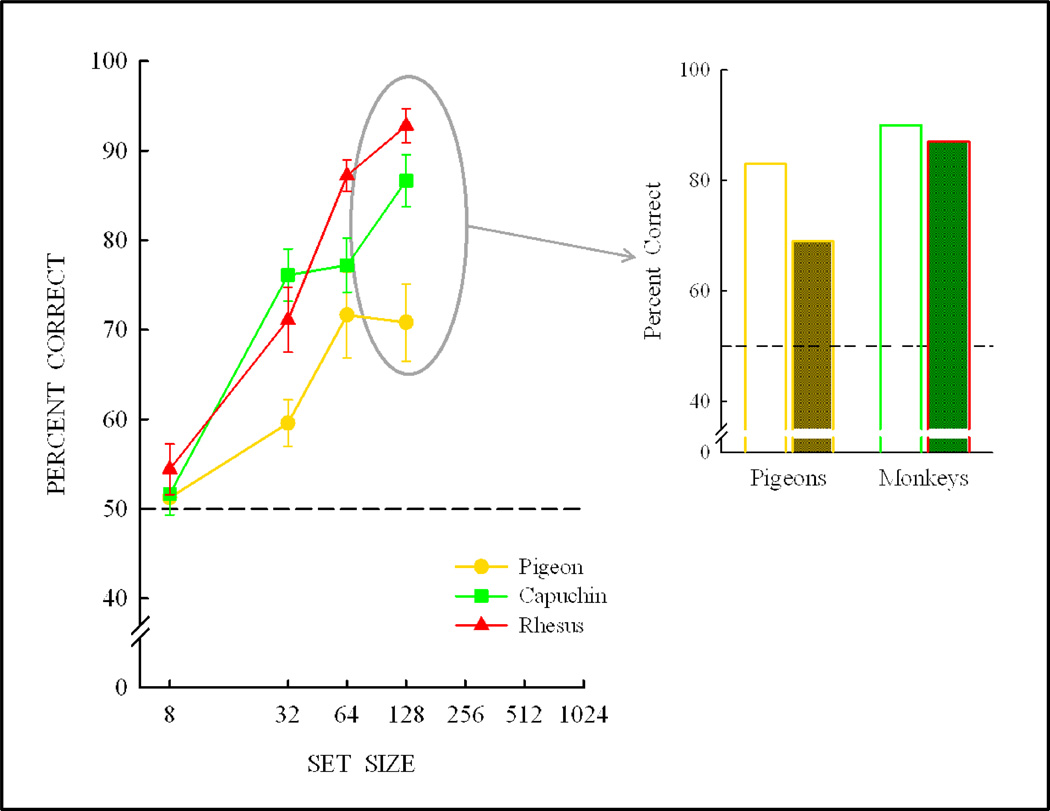
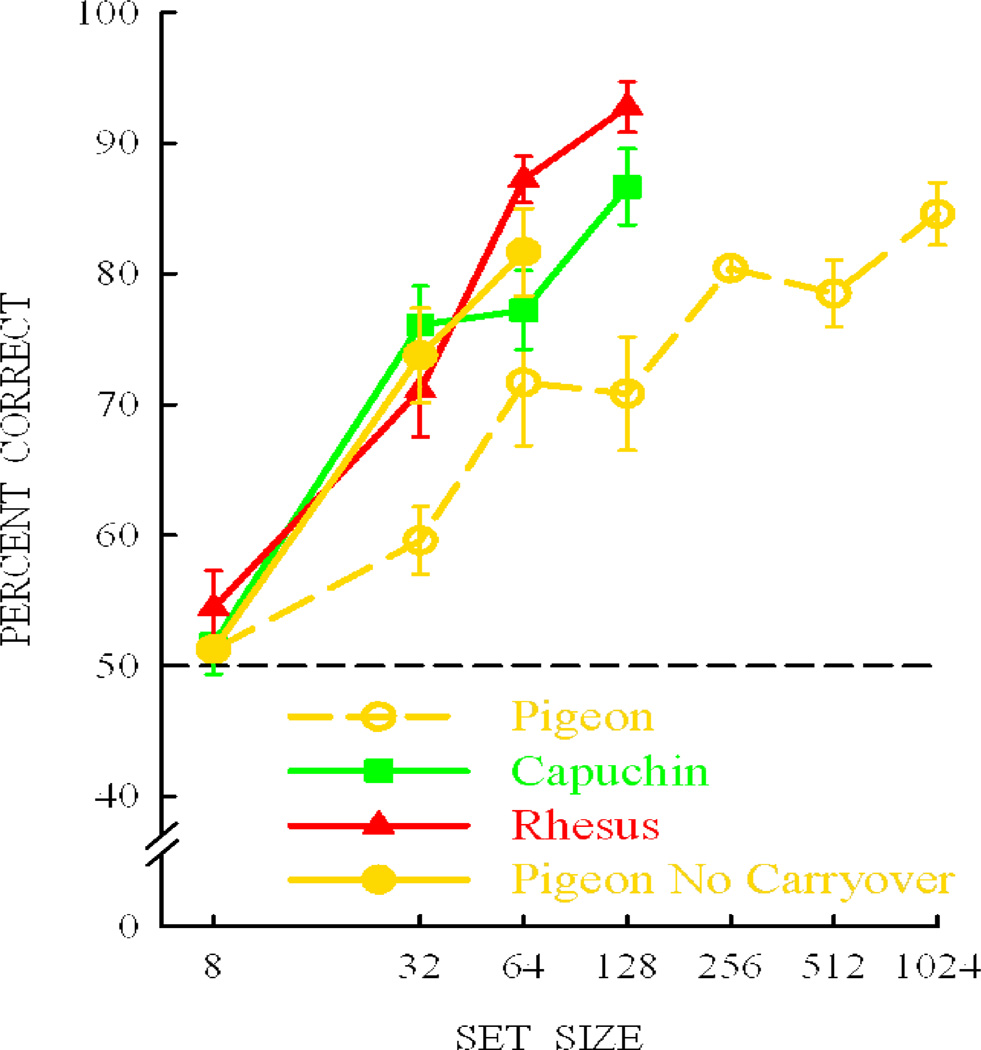
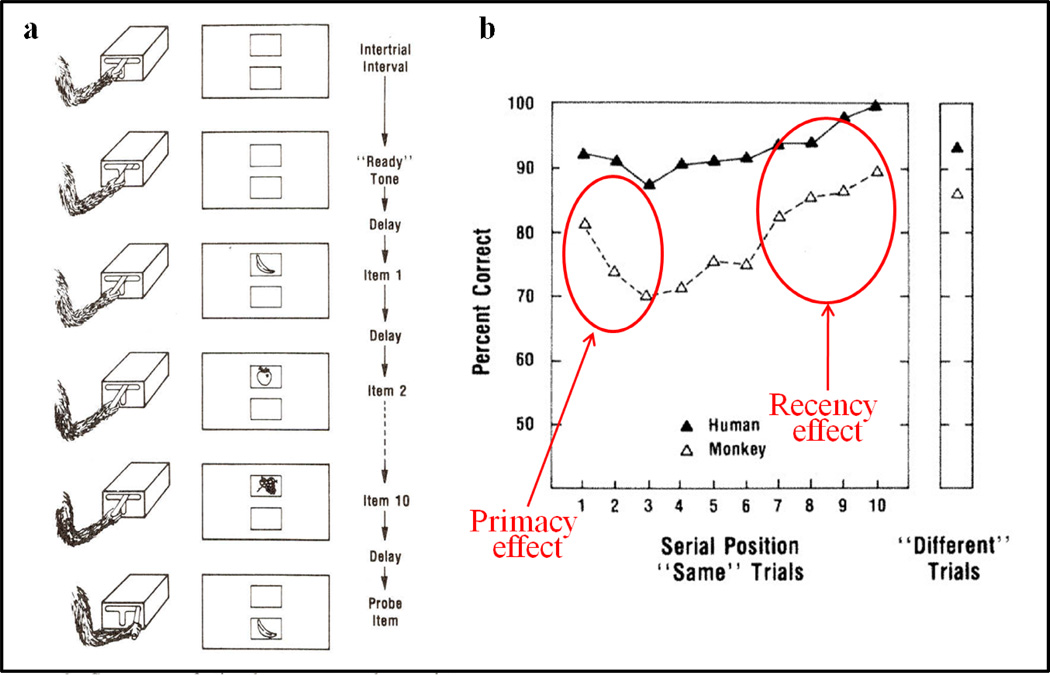
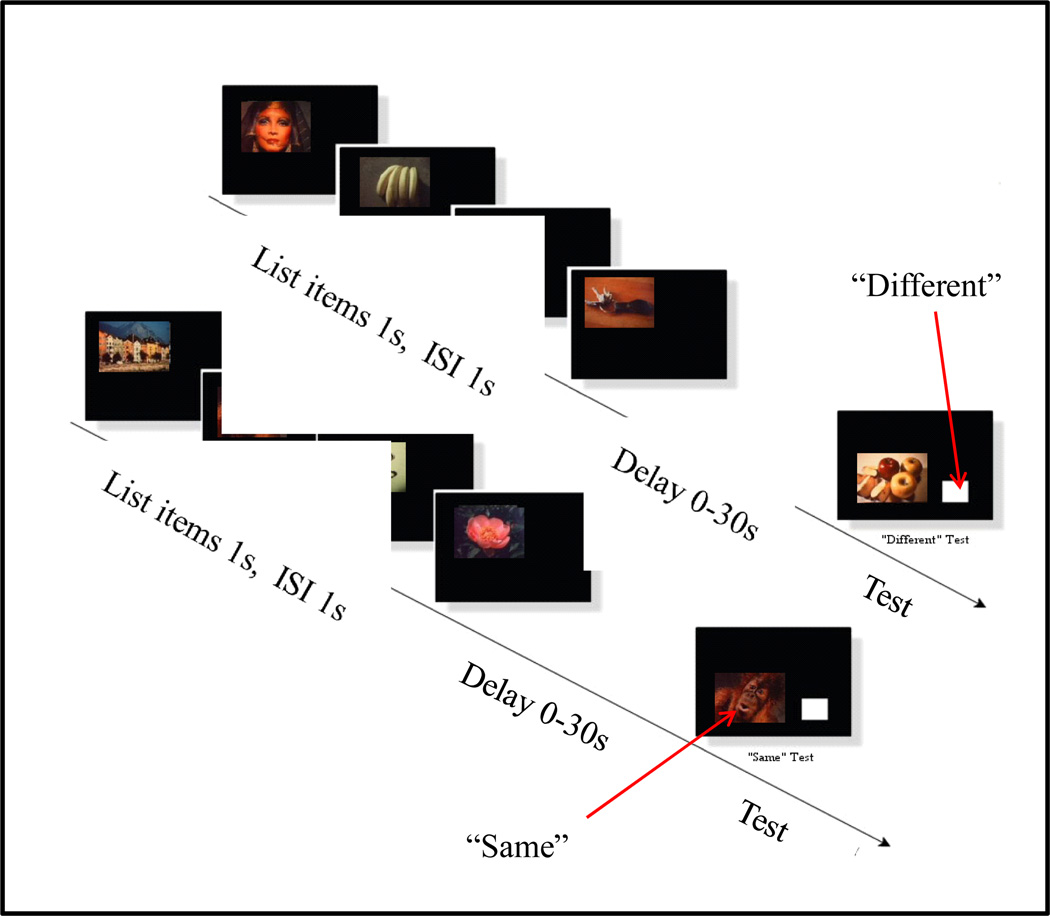
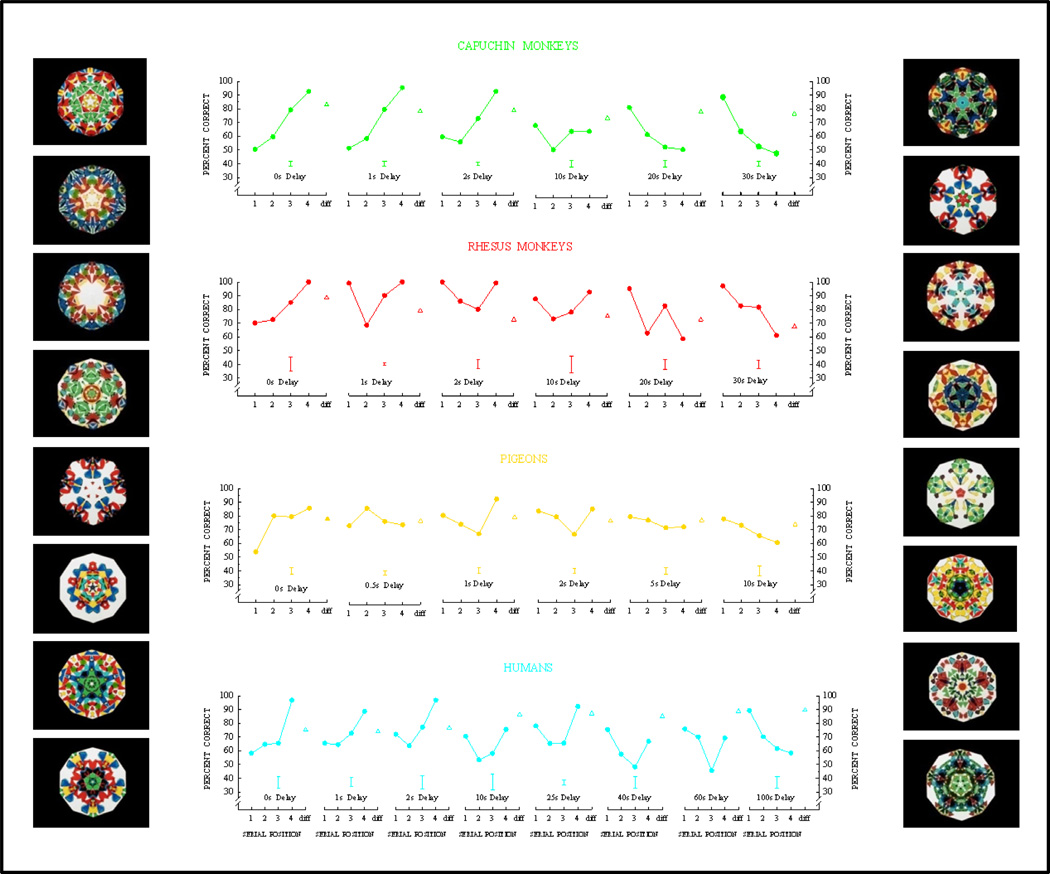
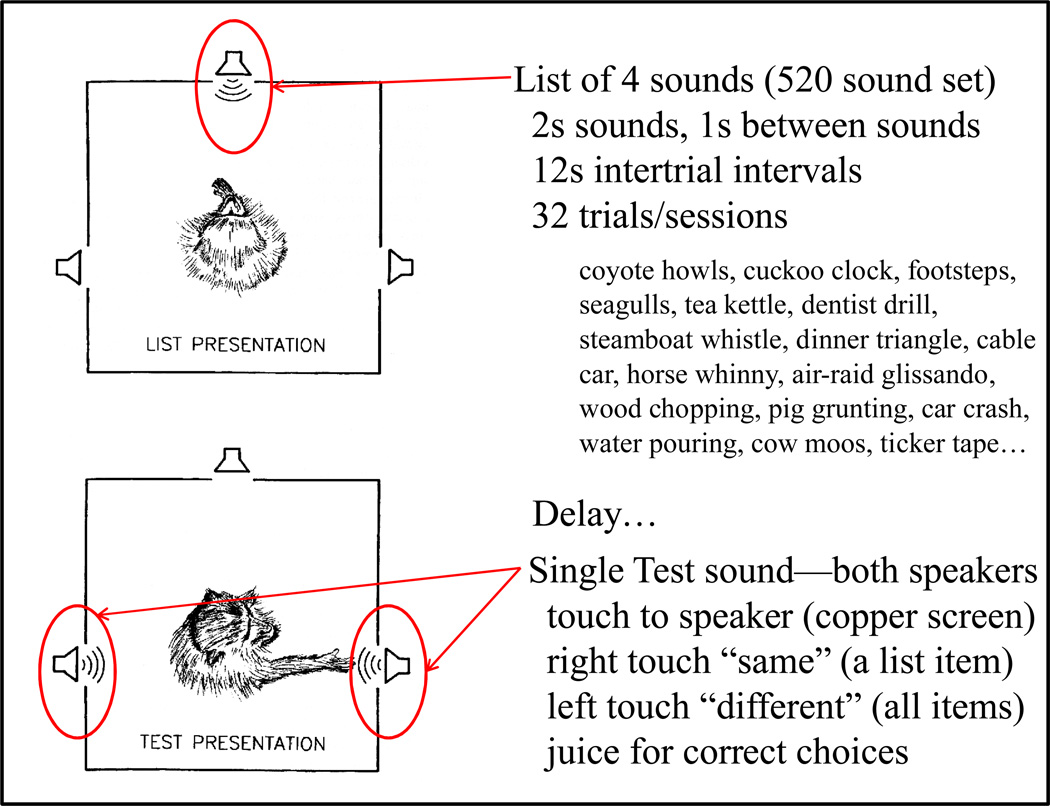
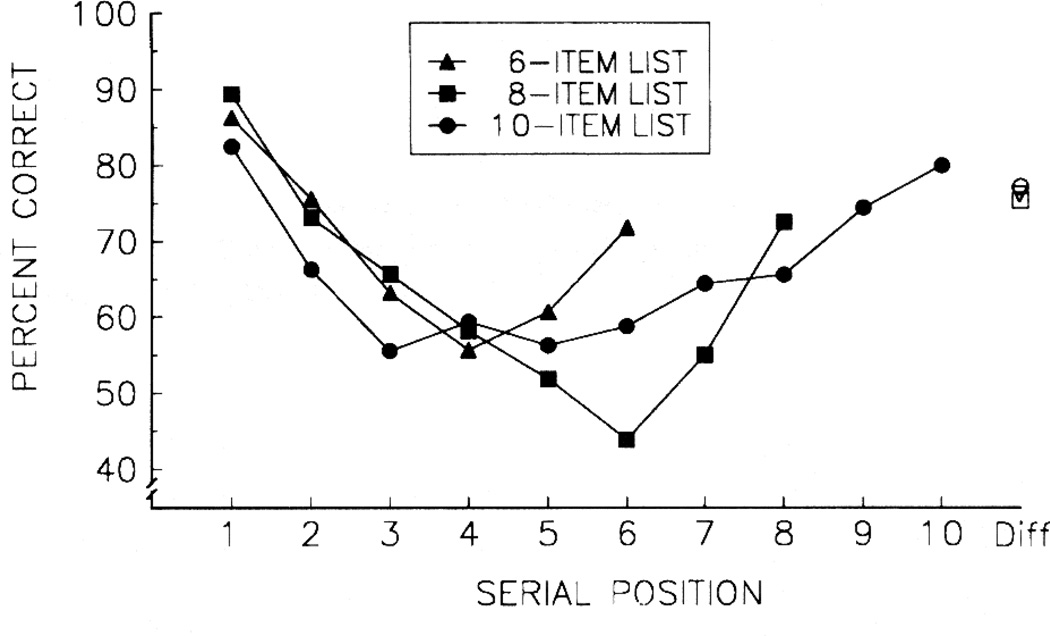
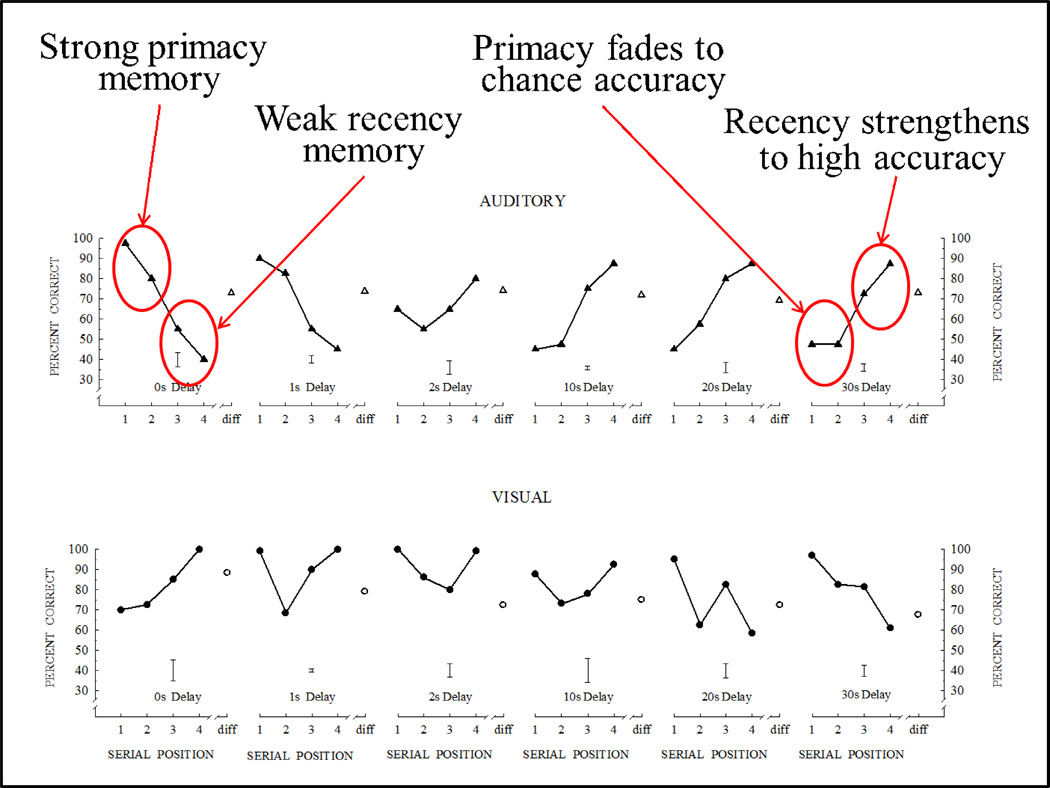
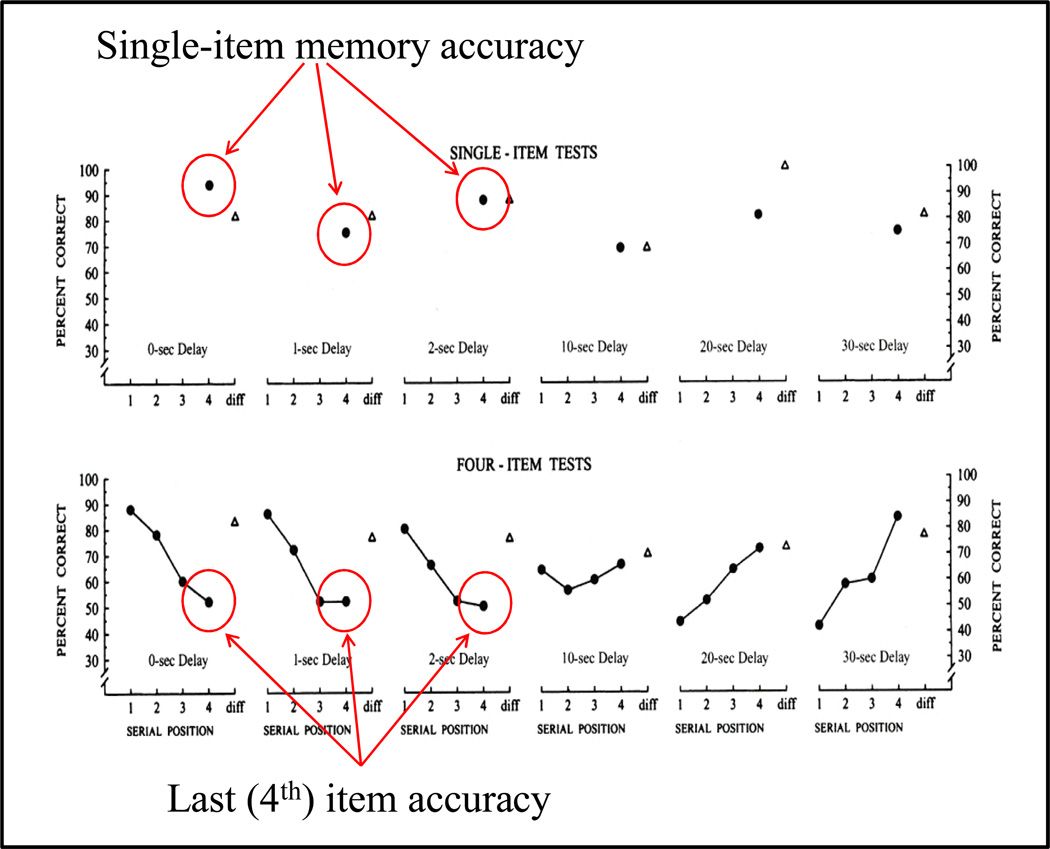
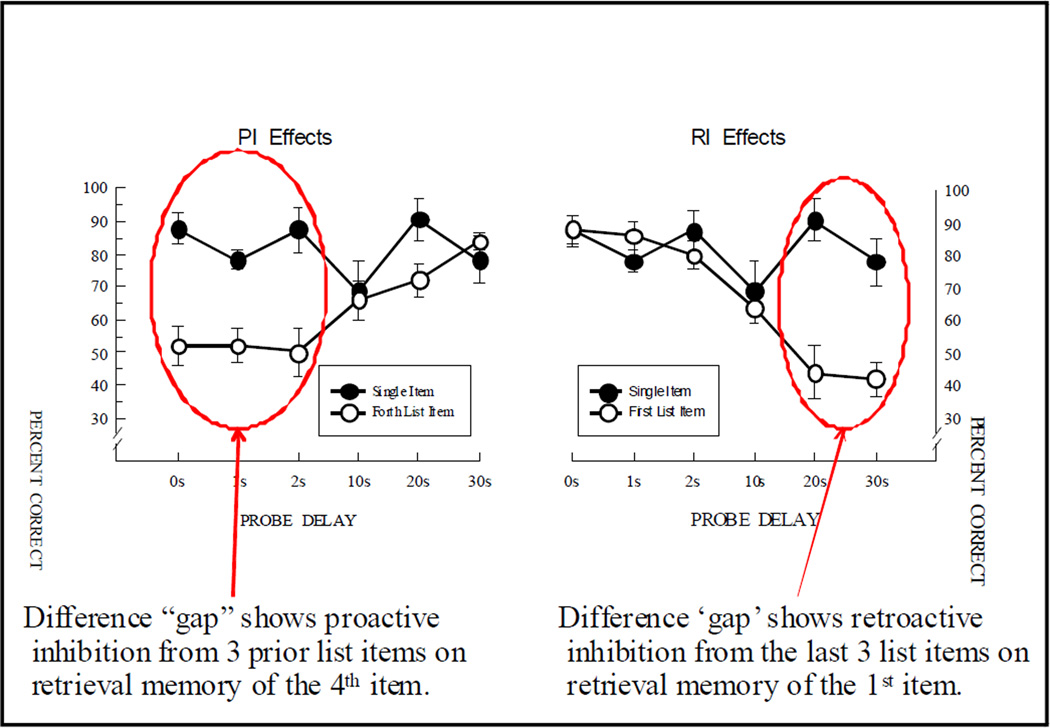
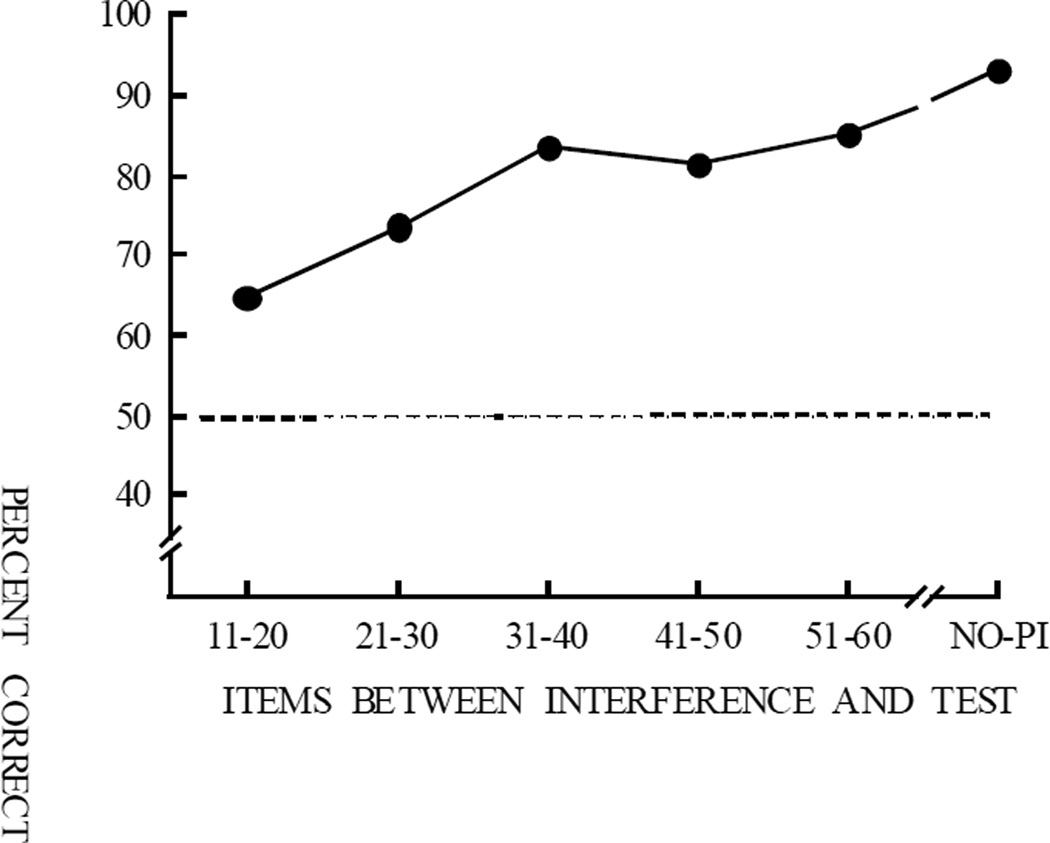
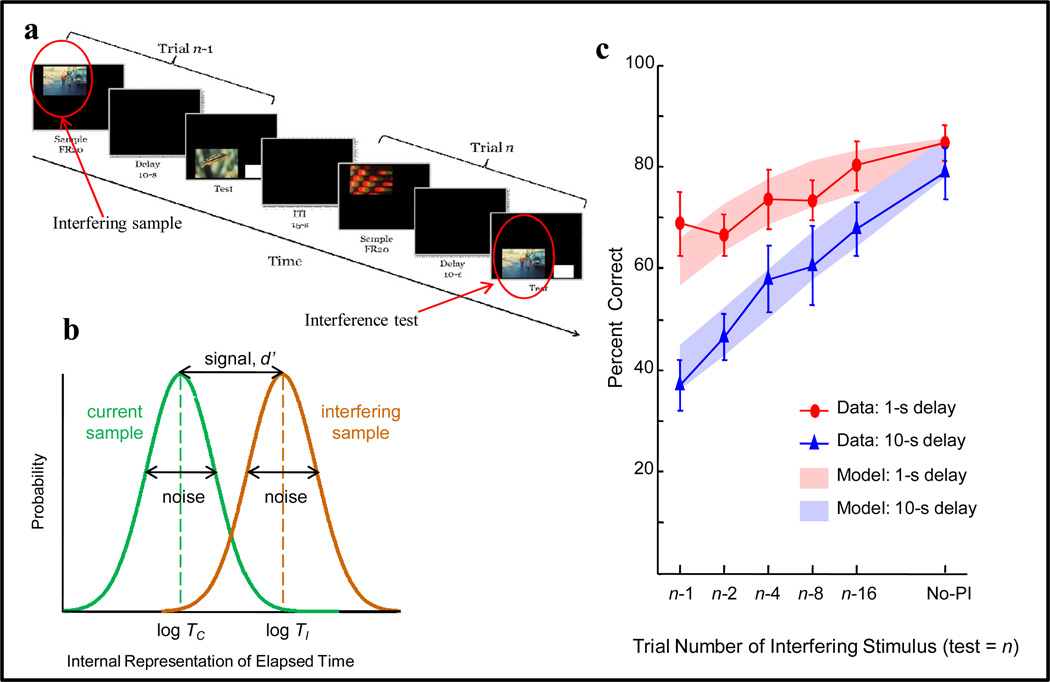
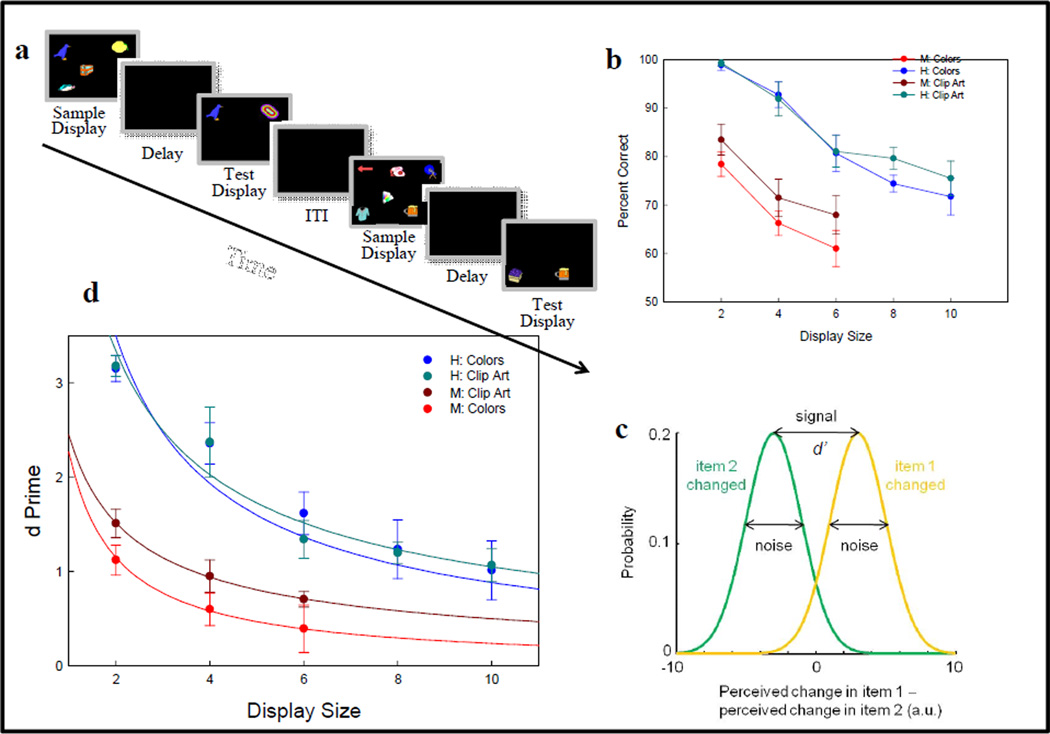
Functional relationships (from systematic manipulation of critical variables) are advocated for revealing fundamental processes of (comparative) cognition-through examples from my work in psychophysics, learning, and memory. Functional relationships for pigeon wavelength (hue) discrimination revealed best discrimination at the spectral points of hue transition for pigeons-a correspondence (i.e., functional relationship) similar to that for humans. Functional relationships for learning revealed: Item-specific or relational learning in matching to sample as a function of the pigeons' sample-response requirement, and same/different abstract-concept learning as a function of the training set size for rhesus monkeys, capuchin monkeys, and pigeons. Functional relationships for visual memory revealed serial position functions (a 1st order functional relationship) that changed systematically with retention delay (a 2nd order relationship) for pigeons, capuchin monkeys, rhesus monkeys, and humans. Functional relationships for rhesus-monkey auditory memory also revealed systematic changes in serial position functions with delay, but these changes were opposite to those for visual memory. Functional relationships for proactive interference revealed interference that varied as a function of a ratio of delay times. Functional relationships for change detection memory revealed (qualitative) similarities and (quantitative) differences in human and monkey visual short-term memory as a function of the number of memory items. It is concluded that these findings were made possible by varying critical variables over a substantial portion of the manipulable range to generate functions and derive relationships.


Figures

Figure 1
Figure 1
Gordon Bower: undergraduate mentor at Stanford University.
Figure 2
Figure 2
Professor Graham and graduate sponsors Bill Cumming and Tony Nevin at Columbia University. Arrow indicates combining these fields for animal psychophysical studies.
Figure 3
Figure 3
(a) Functional relationships for an example from human psychophysical detection of light in the fovea, (b) the periphery, (c) and contrast changes from different backgrounds. These functional relationships show that the product of luminance and time was constant for the left-hand ‘limb’ and luminance was constant for the right-hand ‘limb’ in each condition.
Figure 4
Figure 4
a) Top view of apparatus and (b) procedure for studying pigeon color (hue) discrimination including a split field of two wavelengths of light, same/different ‘report’ pecking keys, and variable reinforcement probability (for correct responses) to generate receiver operating characteristics (ROCs) on (c) linear and (d) z-score axes.
Figure 5
Figure 5
(a) Computation of d’ values according to signal detection theory for examples (b) of equal-bias points (circled) from bird 287’s linear ROCs on z-score axes. (c) Psychometric functions of d’ as a function of wave number (reciprocal of wavelength) difference for 9 reference wavelengths and examples (reference wavelengths of 649.7 & 620.4 nm) for calculating the wave-number differences for the performance criterion of d’=2.0.
Figure 6
Figure 6
(a) All 20 psychometric functions for bird 287. (b) Mean psychophysical hue discrimination functions for the group of 4 pigeons at 9 d’ criteria values showing best discrimination at spectral points of 600, 540, and 500 nm.
Figure 7
Figure 7
(a) Human color naming showing transitions between hues corresponding to points (dips) of best human hue discrimination. (b) Pigeon color naming from a matching-to-sample wavelength generalization experiment showing the correspondence of transitions between three of the pigeon hues to two of the points of best pigeon hue discrimination.
Figure 8
Figure 8
Matching-to-sample procedure for 4 groups (4 pigeons/group) with different sample-response requirements to test item-specific and relational learning with combinations of duck, apple, and grape cartoons. Other training displays for one of the two subgroups are shown at the bottom of the figure.
Figure 9
Figure 9
Left: Apparatus for the matching-to-sample experiment (Figure 8) with the stimuli projected from the floor and mechanical systems to deliver reinforcement grain on top of correct choice stimuli. Right: Examples of novel-stimulus transfer trials.
Figure 10
Figure 10
Results from the four different groups of pigeons trained with either 0, 1, 10, or 20 sample pecks prior to the presentation of the choice cartoons. The first bar (unfilled) for each group shows the group baseline training accuracy during transfer testing. The most important transfer result is the right-hand bar for each group which shows novel transfer accuracy and conclusions that can be drawn from the results of each group.
Figure 11
Figure 11
Rhesus and capuchin monkeys tested in custom aluminum chambers with a juice spout, pellet cup, and template to guide responses. Pigeons tested in custom wooden chamber with a grain hopper and a similar video monitor and touch screen as used with the monkeys.
Figure 12
Figure 12
Same/Different testing procedure with sample touch/peck requirements, “same”/”different” choice responses and examples of the initial 8 training pictures.
Figure 13
Figure 13
Training and transfer for monkeys and pigeons with the initial set of 8 pictures of Figure 12 and the 5 same and 5 different novel transfer trials that were used in the first transfer test session following learning.
Figure 14
Figure 14
Transfer performance with the training set expanded from 8 to 32 pictures. For pigeons, transfer following training with set sizes expanded from the initial 8-item set but less than 32 items would likely show little or no transfer, whereas monkeys would likely show partial transfer and partial abstract-concept learning.
Figure 15
Figure 15
Transfer with further expansion of the training set to 64 items and then to 128 item. Pigeons now show partial transfer (and partial concept learning) following training on 128-item set relative to their baseline performance, whereas at this same set size monkeys show transfer equivalent to their baseline performance—and therefore full abstract-concept learning.
Figure 16
Figure 16
Pigeon transfer with further expansion of the training set to 1024 pictures, resulting in transfer equivalent to their baseline performance and full concept learning—like the monkeys did following training on the 128-item set.
Figure 17
Figure 17
Groups of experimentally naïve pigeons trained initially with either 32 or 64 item sets showing improved transfer which is now equivalent to monkeys trained at these same set sizes with these same items. The results suggest that the previous pigeon groups had detrimental carryover effects from their training with smaller set sizes prior to their transfer at these set sizes.
Figure 18
Figure 18
(a) Schematic of a 10-item list-memory testing procedure. A monkey hand and arm is shown starting a trial by pressing downward on a lever. List pictures are then sequentially presented on an upper screen. Following a delay, a single test picture is presented on a lower screen. The subject moves the lever to the right, a correct response (“same”), indicating that the test picture was in the list. (Left lever movements would indicate that the test picture was not in the list.) (b) Serial position functions for a monkey (Oscar) and a human tested with the same procedure including stimuli, presentation rates, delays, and response lever. Good memory for the first list items (circled) show primacy effects and good memory for the last list items (circled) show recency effects for the monkey and human.
Figure 19
Figure 19
Examples of two, 4-item list-memory trials with travel slides for testing animal list memory.
Figure 20
Figure 20
Serial position functions showing primacy and recency effect changes as a function of retention delay for monkeys, pigeons, and humans. (The fourth item is the last list item.) Mean group error bars are shown below each serial position function. Different-trial performance is shown to the right of each serial position function. Animals were tested with “travel pictures” (Figure 19), and humans were tested with kaleidoscope patterns and kaleidoscope examples are shown on the sides of the figure.
Figure 21
Figure 21
Top-view schematic of the monkey auditory list-memory procedure. Auditory lists were presented from the front speaker. Following presentation of the list and a delay, a single test sound was played (simultaneously) from both side speakers. A right speaker touch was a “same” response, indicating that the test sound was one of the list sounds. (A left speaker touch would indicate that the test sound was not one of the list sounds.) Other procedure details and names of some of the sounds are shown.
Figure 22
Figure 22
Mean auditory serial position functions for two monkeys with lists of 6, 8, or 10 sounds.
Figure 23
Figure 23
Comparison of auditory and visual 4-item serial position functions for rhesus monkeys tested at the same retention delays. The auditory and visual serial position functions are opposite in form and are shown to change in opposite ways with changes in delay.
Figure 24
Figure 24
Single-item auditory memory and 4-item auditory list memory with performance for single items and 4th (last) list items circled at 0-, 1-, and 2-s delays to emphasize differences, in spite of the similar events (delay, test) following these items.
Figure 25
Figure 25
Left: Single-item auditory memory compared to 4th (last) item auditory list memory showing the ‘gap’ in accuracy produced by proactive interference from the previous 3 list items on. Right: Single-item auditory memory compared to first-item of a 4-item auditory list showing the ‘gap’ in accuracy likely produced by retroactive interference retrieval memory of the 1st list item from the last 3 list items at longer delays.
Figure 26
Figure 26
Proactive interference for a monkey accurately performing a 10-item list memory task (see Figure 18). On interference test trials, the test picture matched a list picture from a trial seen 1–6 trials previous but differed from all pictures in the current trial. Proactive interference decreases with trial separation showing a proactive interference function.
Figure 27
Figure 27
(a) Example of two trials from a proactive interference test with pigeons where the interfering stimulus was presented on the preceding trial (n-1) and repeated as the test stimulus on trial n. (b) Signal detection theory model of elapsed time: Log time to the sample on the current (test) trial (log TC) and log time to the interfering sample (log TI). (c) Percentage correct performance for 1-s and 10-s delays, and model fits (1 sigma bands) based on the time ratio log (TC /TI)—see text for further explanation.
Figure 28
Figure 28
(a) Examples of two change-detection trials, one with 4 and the other with 6 different clip-art objects, used to test human and monkey short-term memory. (b) Changes in percent correct as a function of display size (number of memory items) for colored objects and clip art objects. (c) Signal detection theory model for detecting (d’) which of two test objects was changed. (d) Good model fits to d’ plotted as a function of the inverse power law of display size—as predicted from signal detection theory.
Figure 29
Figure 29
(a) Gordon Bower receiving the National Medal of Science from President Bush 2007. (b) Note by Gordon Bower on the flyleaf of my copy of his festschrift book “Memory and Mind” (notice the reference to “The Law of Primacy”).

Comment in

  • Functional relationships.
    Katz JS, Crystal JD. Katz JS, et al. Behav Processes. 2013 Feb;93:1-3. doi: 10.1016/j.beproc.2013.01.004. Epub 2013 Jan 24. Behav Processes. 2013. PMID: 23353725 No abstract available.

References

    1. Alvarez GA, Cavanagh P. The Capacity of Visual Short-Term Memory is Set Both by Visual Information Load and by Number of Objects. Psychological Science. 2004;15:106–111. - PubMed
    1. Atkinson RC, Shiffrin RM. Human memory: A proposed system and its control processes. In: Spence KW, Spence JT, editors. The psychology of learning and motivation. Vol. 2. New York: Academic Press; 1968. pp. 89–105.
    1. Bays PM, Husain M. Dynamic shifts of limited working memory resources in human vision. Science. 2008;321:851–854. - PMC - PubMed
    1. Bower GH. An association model for response and training variables in paired-associate learning. Psychological Review. 1962;69:34–53. - PubMed
    1. Bower GH. Neal E. Miller. Proceedings of the American Philosophical Society. 2011;155:358–365.

Publication types