. 2013 Apr;57(4):1484-97.
doi: 10.1002/hep.26168. Epub 2013 Jan 18.

Discrete nature of EpCAM+ and CD90+ cancer stem cells in human hepatocellular carcinoma

Affiliations

Discrete nature of EpCAM+ and CD90+ cancer stem cells in human hepatocellular carcinoma

Taro Yamashita et al. Hepatology. 2013 Apr.

Abstract

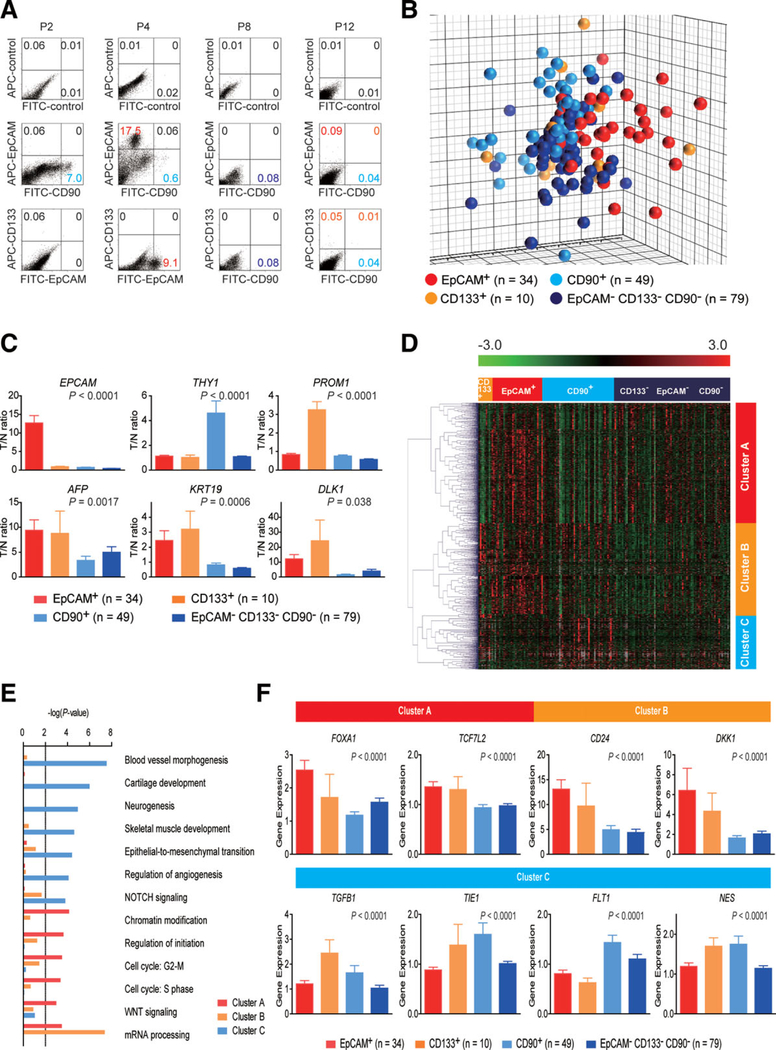
Recent evidence suggests that hepatocellular carcinoma (HCC) is organized by a subset of cells with stem cell features (cancer stem cells; CSCs). CSCs are considered a pivotal target for the eradication of cancer, and liver CSCs have been identified by the use of various stem cell markers. However, little information is known about the expression patterns and characteristics of marker-positive CSCs, hampering the development of personalized CSC-targeted therapy. Here, we show that CSC markers EpCAM and CD90 are independently expressed in liver cancer. In primary HCC, EpCAM+ and CD90+ cells resided distinctively, and gene-expression analysis of sorted cells suggested that EpCAM+ cells had features of epithelial cells, whereas CD90+ cells had those of vascular endothelial cells. Clinicopathological analysis indicated that the presence of EpCAM+ cells was associated with poorly differentiated morphology and high serum alpha-fetoprotein (AFP), whereas the presence of CD90+ cells was associated with a high incidence of distant organ metastasis. Serial xenotransplantation of EpCAM+ /CD90+ cells from primary HCCs in immune-deficient mice revealed rapid growth of EpCAM+ cells in the subcutaneous lesion and a highly metastatic capacity of CD90+ cells in the lung. In cell lines, CD90+ cells showed abundant expression of c-Kit and in vitro chemosensitivity to imatinib mesylate. Furthermore, CD90+ cells enhanced the motility of EpCAM+ cells when cocultured in vitro through the activation of transforming growth factor beta (TGF-β) signaling, whereas imatinib mesylate suppressed TGFB1 expression in CD90+ cells as well as CD90+ cell-induced motility of EpCAM+ cells.

Conclusion: Our data suggest the discrete nature and potential interaction of EpCAM+ and CD90+ CSCs with specific gene-expression patterns and chemosensitivity to molecular targeted therapy. The presence of distinct CSCs may determine the clinical outcome of HCC.


Figures

Fig. 1.
Fig. 1.
Gene-expression profiles of CSC marker-positive HCCs. (A) FACS analysis of primary HCCs stained with fluorescent-labeled Abs against EpCAM, CD90, or CD133. (B) Multidimensional scaling analysis of 172 HCC cases characterized by the expression patterns of EpCAM, CD133, and CD90. Red, EpCAM+ CD90 CD133 (n = 34); orange, EpCAM CD90 CD133+ (n = 10); light blue, EpCAM CD90+ CD133 (n = 49); blue, EpCAM CD90 CD133 (n = 79). HCC specimens were clustered in specific groups with statistical significance (P < 0.001). (C) Expression patterns of well-known hepatic stem/progenitor markers in each HCC subtype, as analyzed by microarray. Red bar, EpCAM+; orange bar, CD133+; light blue bar, CD90+; blue bar, EpCAM CD90 CD133. (D) Hierarchical cluster analysis based on 1,561 EpCAM/CD90/ CD133-coregulated genes in 172 HCC cases. Each cell in the matrix represents the expression level of a gene in an individual sample. Red and green cells depict high and low expression levels, respectively, as indicated by the scale bar. (E) Pathway analysis of EpCAM/CD90/CD133coregulated genes. Canonical signaling pathways activated in cluster A (red bar), cluster B (orange bar), or cluster C (light blue bar) with statistical significance (P < 0.01) are shown. (F) Expression patterns of representative genes differentially expressed in EpCAM/CD90/CD133 HCC subtypes. Red bar, EpCAM+; orange bar, CD133+; light blue bar, CD90+; blue bar, EpCAM CD133 CD90.
Fig. 2.
Fig. 2.
Distinct EpCAM+ and CD90+ cell populations in HCC. (A) Representative images of EpCAM and CD90 staining in dysplastic nodule (panels a,c) and HCC (panels b,d) by IHC analysis (scale bar, 50 μm). EpCAM (panels a,b) and CD90 (panels c,d) immunostaining is depicted. (B) Upper panel: representative images of EpCAM (red) and CD90 (brown) double staining in HCC by IHC (scale bar, 50 μm). Lower panel: representative images of EpCAM (green) and CD90 (red) staining with 4’6-diamidino-phenylindole (DAPI) (blue) in HCC by IF (scale bar, 50 μm). (C) qPCR analysis of sorted EpCAM+ (red bar), CD90+ (orange bar), or EpCAM CD90 (blue bar) derived from a representative primary HCC. Experiments were performed in triplicate, and data are shown as mean ± standard error of the mean.
Fig. 3.
Fig. 3.
Characteristics of HCC cell lines defined by EpCAM and CD90. (A) Representative photomicrographs of EpCAM+CD90 and EpCAM CD90+ HCC cell lines. (B) Representative FACS data of EpCAM+CD90 and EpCAM CD90+ HCC cell lines stained with fluorescein isothiocyanate (FITC)-EpCAM and APC-CD90 Abs. (C) Heat-map images of seven HCC cell lines based on 890 EpCAM/CD90-coregulated genes. Each cell in the matrix represents the expression level of a gene in an individual sample. Red and green cells depict high and low expression levels, respectively, as indicated by the scale bar. (D and E) Pathway analysis of EpCAM/CD90-coregulated genes. Canonical signaling pathways activated in cluster I (orange bar) or II (blue bar) with statistical significance (P < 0.01) are shown. (F) qPCR of representative differentially expressed genes identified by microarray analysis (C) in seven HCC cell lines.
Fig. 4.
Fig. 4.
Distinct tumorigenic/metastatic capacities of HCC cell lines defined by EpCAM and CD90. (A) Tumorigenicity of 1 × 10⁵ cells sorted by anti-EpCAM (HuH1 and HuH7) or anti-CD90 (HLE and HLF) Abs. Data are generated from 8 mice/cell line. (B) Tumorigenic ability of EpCAM+ and CD90+ sorted cells in NOD/SCID mice. Aggressive tumor growth in the SC lesion was observed in EpCAM+ HuH1 or HuH7 cells, compared with CD90+ HLE or HLF cells. EpCAM+ (1 × 10⁵) or CD90+ cells were injected. Tumor-volume curves are depicted as mean ± standard deviation of 4 mice/group. (C) Histological analysis of EpCAM+ or CD90+ cell-derived xenografts. Hematoxylin and eosin (H&E) staining of a SC tumor (upper panels) and IHC of the tumor with anti-EpCAM (middle panels) or anti-CD90 Abs (bottom panels) are shown (scale bar, 50 μm). (D) Metastasis was evaluated macroscopically and microscopically in the left and right lobes of the lung separately in each mouse (n = 4) (scale bar, 100 μm).
Fig. 5.
Fig. 5.
Tumorigenic/metastatic capacities of EpCAM+ and CD90+ cells in primary HCC. (A) Representative NOD/SCID mice with SC tumors (white arrows) from EpCAM+ P4 or P7 cells (left and middle panels) and CD90+ or CD90 P12 cells (right panel). (B) FACS analysis of CD90 and EpCAM staining in primary HCCs and the corresponding secondary tumors developed in NOD/SCID mice. Unsorted cells (1 × 10⁶ cells in P4 and P7 or 1 × 10⁵ cells in P12) were SC injected to evaluate the frequency of each marker-positive cell in primary and secondary tumors. (C) IHC analysis of EpCAM and CD90 in primary HCCs P4, P7, and P12 (scale bar, 50 μm). (D) FACS analysis of VEGFR1 (Alexa488) and CD105 (APC) in primary HCC P12. (E) Hematoxylin and eosin staining of lung tissues in P4 and P12 (scale bar, 200 μm). (F) Frequency of lung metastasis in NOD/SCID mice SC transplanted using unsorted primary HCC cells.
Fig. 6.
Fig. 6.
Suppression of lung metastasis mediated by CD90+ CSCs by imatinib mesylate. (A) FACS analysis of seven HCC cell lines stained by APC-CD105, Alexa 488/VEGFR1, APC/VEGFR2, and Alexa 488/c-Kit Abs or isotype control. (B) Tumorigenicity of 5 × 10⁵ HuH7 cells and 2.5 × 10⁵ HuH7 cells plus 2.5 × 10⁵ HLF cells treated with imatinib mesylate or control phosphate-buffered saline (PBS) (200 μL/mouse) orally ingested three times per week (100 mg/kg) for 2 weeks. Data are generated from 5 mice per condition. (C) IHC analysis of EpCAM in lung metastasis detected in NOD/SCID mice SC injected with 2.5 × 10⁵ HuH7 cells and 2.5 × 10⁵ HLF cells. Metastasis was evaluated macro- and microscopically in the left and right lobes of the lung separately in each mouse (n = 5) (scale bar, 100 μm). (D) Cell motility of HuH7 cells cocultured with HuH7, HLF, or HLF cells with imatinib mesylate (10 μM) was monitored in a real-time manner by time-lapse image analysis. HuH7 and HLF cells were labeled with the lipophilic fluorescence tracer, Dil (indicated as red) or DiD (indicated as blue), and incubated in a μ-Slide eight-well chamber overnight. Silicone inserts were detached and the culture media replaced with Dulbecco’s modified Eagle’s medium containing 10% fetal bovine serum, including 0.1% dimethyl sulfoxide (DMSO) (control) or 10 μM of imatinib mesylate dissolved in DMSO (final concentration 0.1%). Immediately after the medium change, cells were cultured at 37°C in 5% CO2 and time-lapse images were captured for 72 hours. (E) qPCR analysis of TGFB1 in HuH7 (white bar), HLF (gray bar), and HLF cells pretreated with imatinib mesylate for 24 hours. (F) Smad3 and its phosphorylation evaluated by western blotting. HuH7 cells and HLF cells were harvested in cell culture inserts and treated with DMSO (0.1%) or imatinib mesylate (10 μM) for 24 hours. Cell culture inserts were washed with PBS, cocultured with HuH7 cells for 8 hours, and then removed. HuH7 cells were lysed using radioimmunoprecipitation assay buffer for western blotting. (A) HuH7 cells cocultured with HuH7 cells. (B) HuH7 cells cocultured with HLF cells. (C) HuH7 cells cocultured with HLF cells pretreated with imatinib mesylate.

References

    1. Tsai WL, Chung RT. Viral hepatocarcinogenesis. Oncogene 2010;29: 2309–2324. - PMC - PubMed
    1. Chiba T, Kita K, Zheng YW, Yokosuka O, Saisho H, Iwama A, et al. Side population purified from hepatocellular carcinoma cells harbors cancer stem cell-like properties. HEPATOLOGY 2006;44:240–251. - PubMed
    1. Haraguchi N, Ishii H, Mimori K, Tanaka F, Ohkuma M, Kim HM, et al. CD13 is a therapeutic target in human liver cancer stem cells. J Clin Invest 2010;120:3326–3339. - PMC - PubMed
    1. Ma S, Tang KH, Chan YP, Lee TK, Kwan PS, Castilho A, et al. miR130b promotes CD133(+) liver tumor-initiating cell growth and self-renewal via tumor protein 53-induced nuclear protein 1. Cell Stem Cell 2010;7:694–707. - PubMed
    1. Yang ZF, Ho DW, Ng MN, Lau CK, Yu WC, Ngai P, et al. Significance of CD90+ cancer stem cells in human liver cancer. Cancer Cell 2008;13:153–166. - PubMed

Publication types

MeSH terms