

Macrophage migration inhibitory factor contributes to ethanol-induced liver injury by mediating cell injury, steatohepatitis, and steatosis
- PMID: 23174952
- PMCID: PMC3597752
- DOI: 10.1002/hep.26169
Macrophage migration inhibitory factor contributes to ethanol-induced liver injury by mediating cell injury, steatohepatitis, and steatosis
Abstract
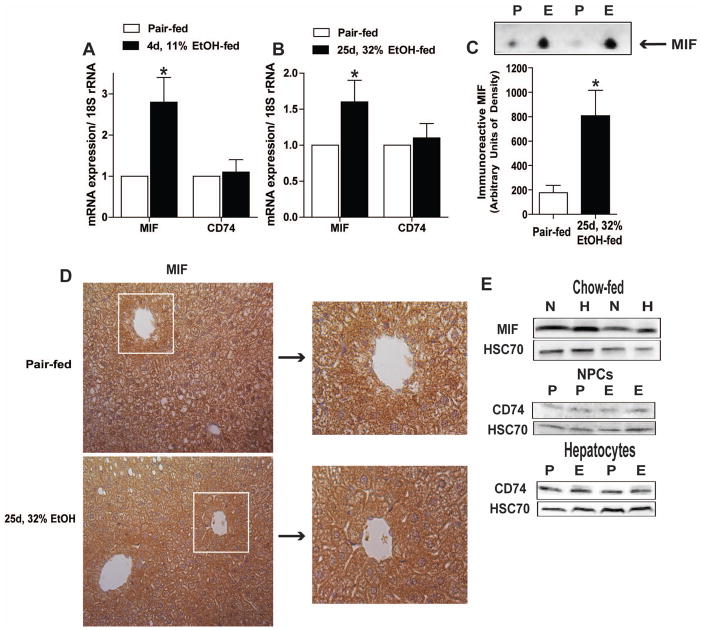
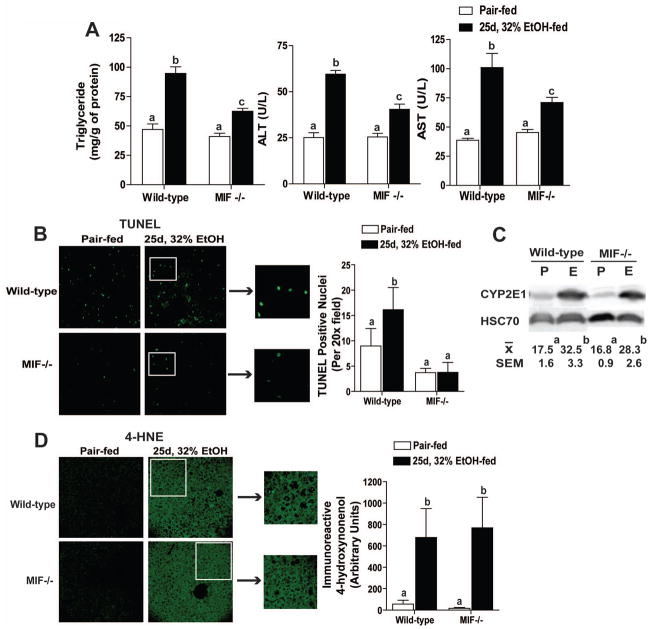
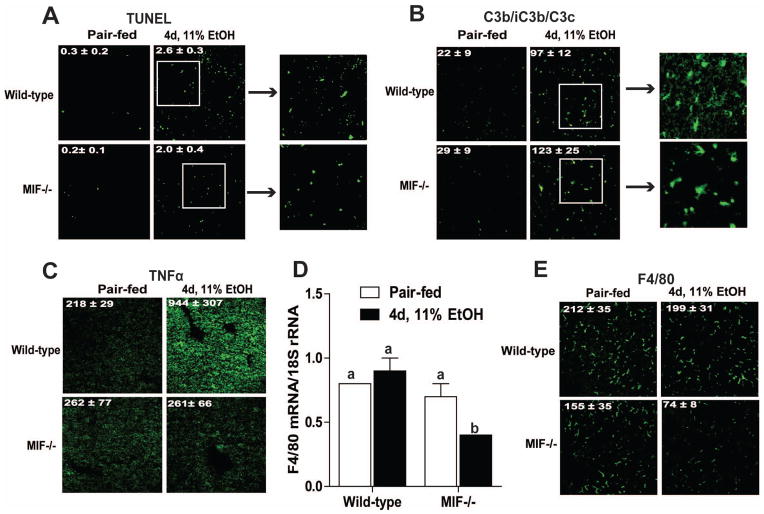
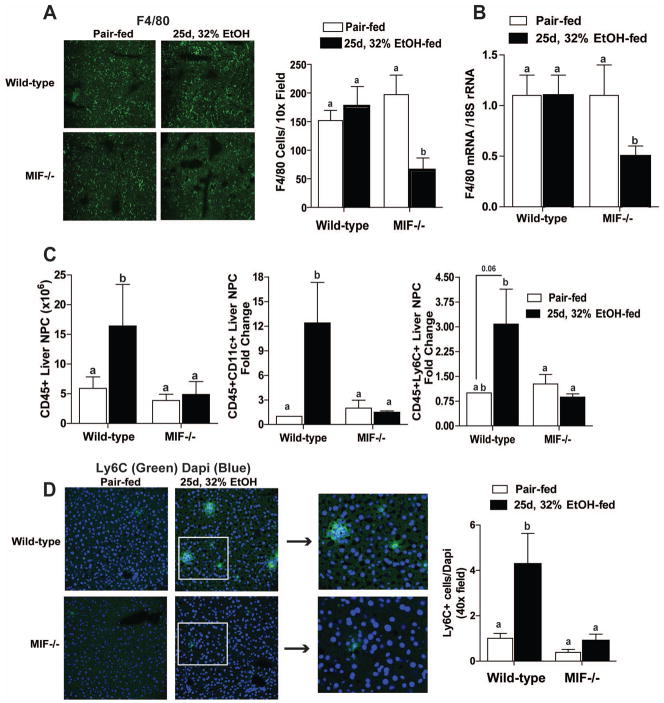
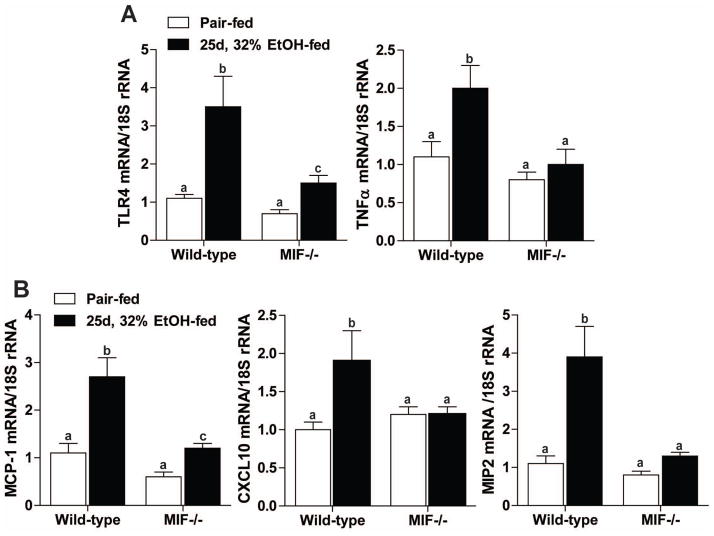
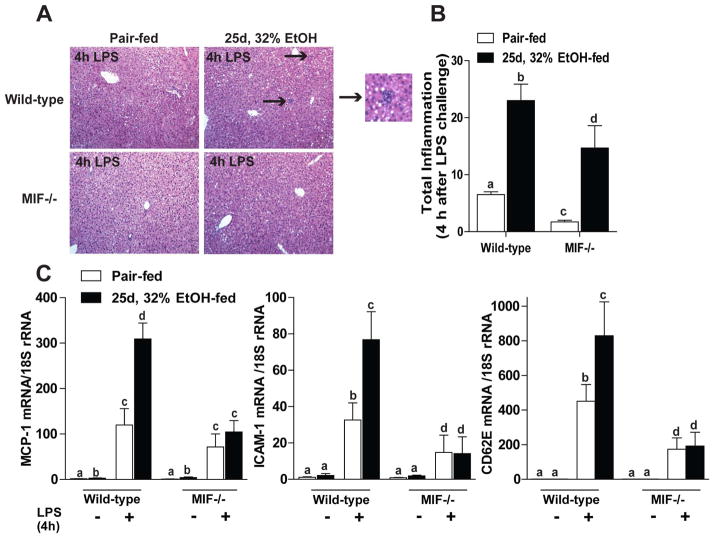
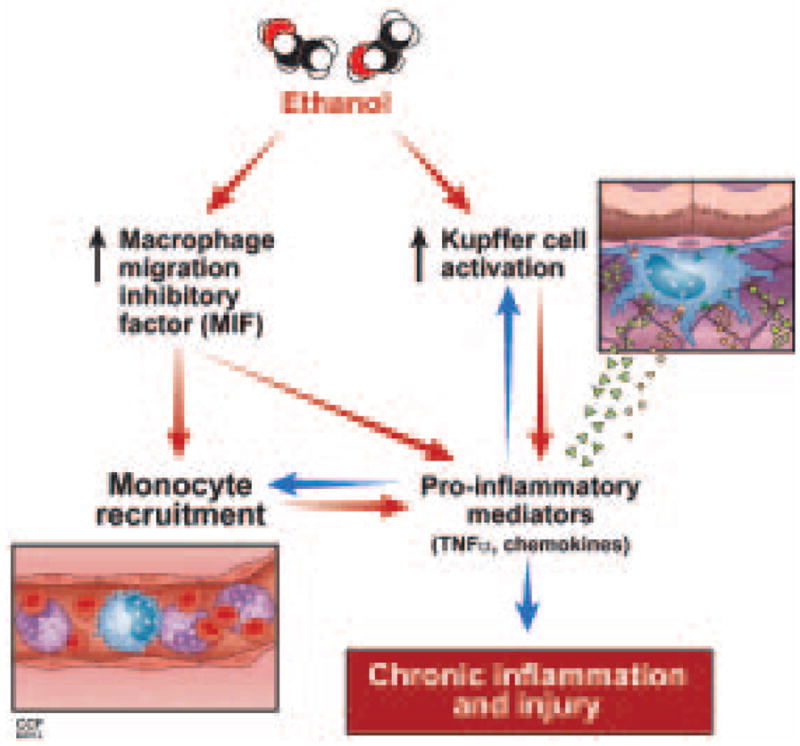
Macrophage migration inhibitory factor (MIF), a multipotent protein that exhibits both cytokine and chemotactic properties, is expressed by many cell types, including hepatocytes and nonparenchymal cells. We hypothesized that MIF is a key contributor to liver injury after ethanol exposure. Female C57BL/6 or MIF-/- mice were fed an ethanol-containing liquid diet or pair-fed control diet for 4 (11% total kcal;early response) or 25 (32% kcal; chronic response) days. Expression of MIF messenger RNA (mRNA) was induced at both 4 days and 25 days of ethanol feeding. After chronic ethanol, hepatic triglycerides and plasma alanine aminotransferase (ALT) and aspartate aminotransferase (AST) were increased in wildtype, but not MIF-/-, mice. In order to understand the role of MIF in chronic ethanol-induced liver injury, we investigated the early response of wildtype and MIF-/- to ethanol. Ethanol feeding for 4 days increased apoptosis of hepatic macrophages and activated complement in both wildtype and MIF-/- mice. However, tumor necrosis factor alpha (TNF-α) expression was increased only in wildtype mice. This attenuation of TNF-α expression was associated with fewer F4/80+ macrophages in liver of MIF-/- mice. After 25 days of ethanol feeding, chemokine expression was increased in wildtype mice, but not MIF-/- mice. Again, this protection was associated with decreased F4/80+ cells in MIF-/- mice after ethanol feeding. Chronic ethanol feeding also sensitized wildtype, but not MIF-/-, mice to lipopolysaccharide, increasing chemokine expression and monocyte recruitment into the liver.
Conclusion: Taken together, these data indicate that MIF is an important mediator in the regulation of chemokine production and immune cell infiltration in the liver during ethanol feeding and promotes ethanol-induced steatosis and hepatocyte damage.
Copyright © 2012 American Association for the Study of Liver Diseases.
Figures
Similar articles
-
Hepatocyte-derived macrophage migration inhibitory factor mediates alcohol-induced liver injury in mice and patients.J Hepatol. 2017 Nov;67(5):1018-1025. doi: 10.1016/j.jhep.2017.06.014. Epub 2017 Jun 22. J Hepatol. 2017. PMID: 28647568 Free PMC article.
-
Osteopontin binding to lipopolysaccharide lowers tumor necrosis factor-α and prevents early alcohol-induced liver injury in mice.Hepatology. 2014 Apr;59(4):1600-16. doi: 10.1002/hep.26931. Epub 2014 Mar 1. Hepatology. 2014. PMID: 24214181 Free PMC article.
-
Novel Role of Macrophage Migration Inhibitory Factor in Upstream Control of the Unfolded Protein Response After Ethanol Feeding in Mice.Alcohol Clin Exp Res. 2019 Jul;43(7):1439-1451. doi: 10.1111/acer.14065. Epub 2019 May 14. Alcohol Clin Exp Res. 2019. PMID: 31009094 Free PMC article.
-
Macrophage migration inhibitory factor in the pathogenesis of leukemia (Review).Int J Oncol. 2021 Aug;59(2):62. doi: 10.3892/ijo.2021.5242. Epub 2021 Jul 19. Int J Oncol. 2021. PMID: 34278453 Review.
-
Macrophage migration inhibitory factor (MIF): A multifaceted cytokine regulated by genetic and physiological strategies.Pharmacol Ther. 2022 May;233:108024. doi: 10.1016/j.pharmthera.2021.108024. Epub 2021 Oct 19. Pharmacol Ther. 2022. PMID: 34673115 Review.
Cited by
-
Differential contribution of complement receptor C5aR in myeloid and non-myeloid cells in chronic ethanol-induced liver injury in mice.Mol Immunol. 2016 Jul;75:122-32. doi: 10.1016/j.molimm.2016.05.006. Epub 2016 Jun 6. Mol Immunol. 2016. PMID: 27280845 Free PMC article.
-
Chronic Alcohol Exposure Enhances Lipopolysaccharide-Induced Lung Injury in Mice: Potential Role of Systemic Tumor Necrosis Factor-Alpha.Alcohol Clin Exp Res. 2015 Oct;39(10):1978-88. doi: 10.1111/acer.12855. Epub 2015 Sep 18. Alcohol Clin Exp Res. 2015. PMID: 26380957 Free PMC article.
-
Macrophages and Alcohol-Related Liver Inflammation.Alcohol Res. 2015;37(2):251-62. Alcohol Res. 2015. PMID: 26717583 Free PMC article. Review.
-
Myeloid Mixed Lineage Kinase 3 Contributes to Chronic Ethanol-Induced Inflammation and Hepatocyte Injury in Mice.Gene Expr. 2016;17(1):61-77. doi: 10.3727/105221616X691730. Epub 2016 Jun 9. Gene Expr. 2016. PMID: 27302422 Free PMC article.
-
Innate immunity and cell death in alcoholic liver disease: role of cytochrome P4502E1.Redox Biol. 2014 Aug 1;2:929-35. doi: 10.1016/j.redox.2014.07.007. eCollection 2014. Redox Biol. 2014. PMID: 25180169 Free PMC article. Review.
References
-
- Tome S, Lucey MR. Review article: current management of alcoholic liver disease. Aliment Pharmacol Ther. 2004;19:707–714. - PubMed
-
- Gao B, Jeong W-I, Tian Z. Liver: An organ with predominant innate immunity. Hepatology. 2008;47:729–736. - PubMed
-
- Altamirano J, Bataller R. Alcoholic liver disease: pathogenesis and new targets for therapy. Nat Rev Gastroenterol Hepatol. 2011;8:491–501. - PubMed
-
- Yin M, Wheeler MD, Kono H, Bradford BU, Gallucci RM, Luster MI, Thurman RG. Essential role of tumor necrosis factor α in alcohol-induced liver injury in mice. Gastroenterology. 1999;117:942–952. - PubMed
Publication types
MeSH terms
Substances
Grants and funding
LinkOut - more resources
Full Text Sources
Other Literature Sources
Medical
Miscellaneous