. 2013 Mar;20(3):396-407.
doi: 10.1038/cdd.2012.150. Epub 2012 Nov 23.

Type-3 metabotropic glutamate receptors regulate chemoresistance in glioma stem cells, and their levels are inversely related to survival in patients with malignant gliomas

Affiliations

Type-3 metabotropic glutamate receptors regulate chemoresistance in glioma stem cells, and their levels are inversely related to survival in patients with malignant gliomas

C Ciceroni et al. Cell Death Differ. 2013 Mar.

Abstract

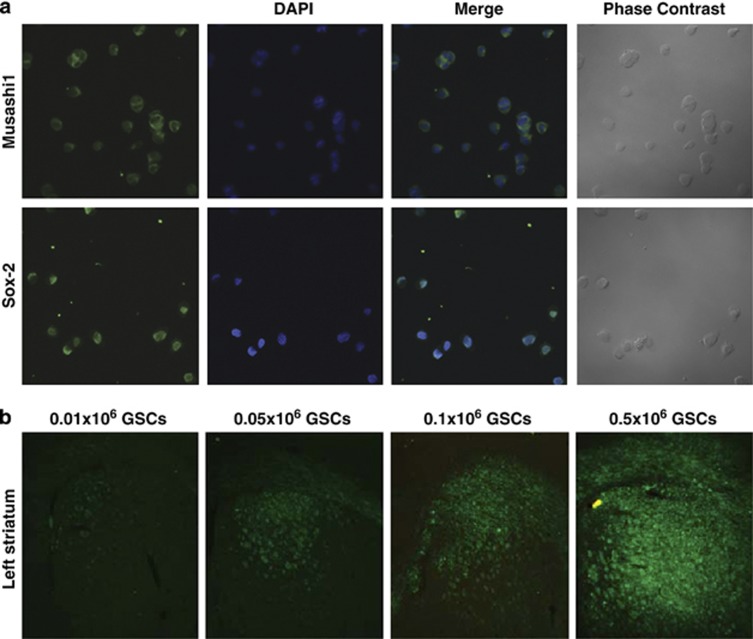
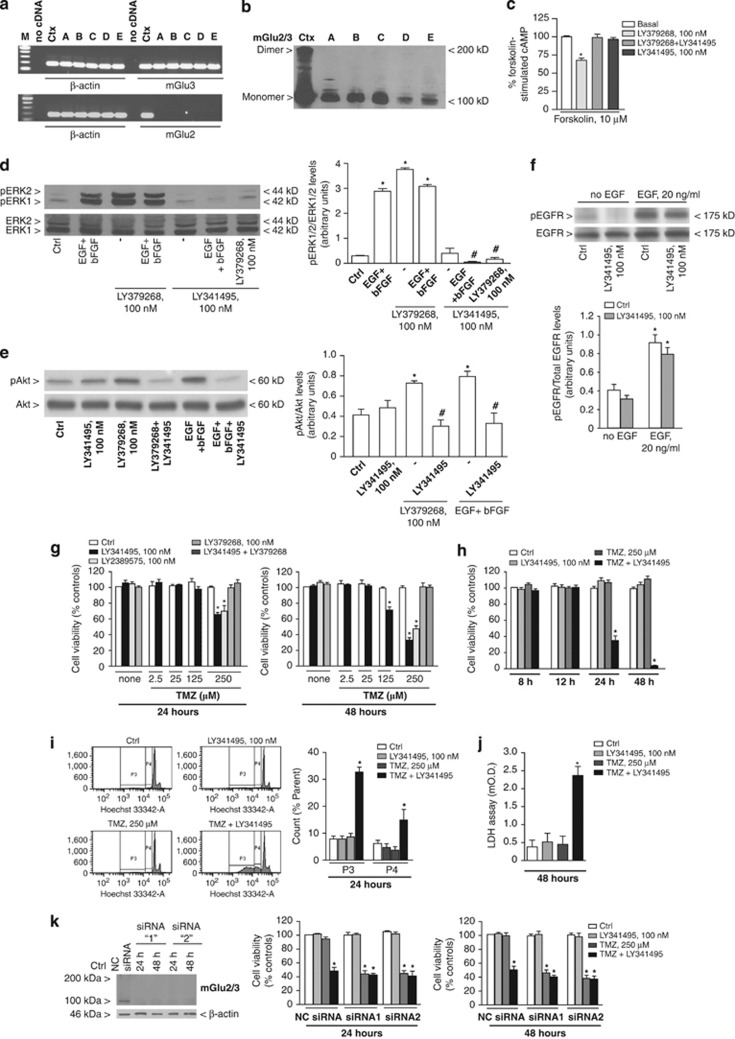
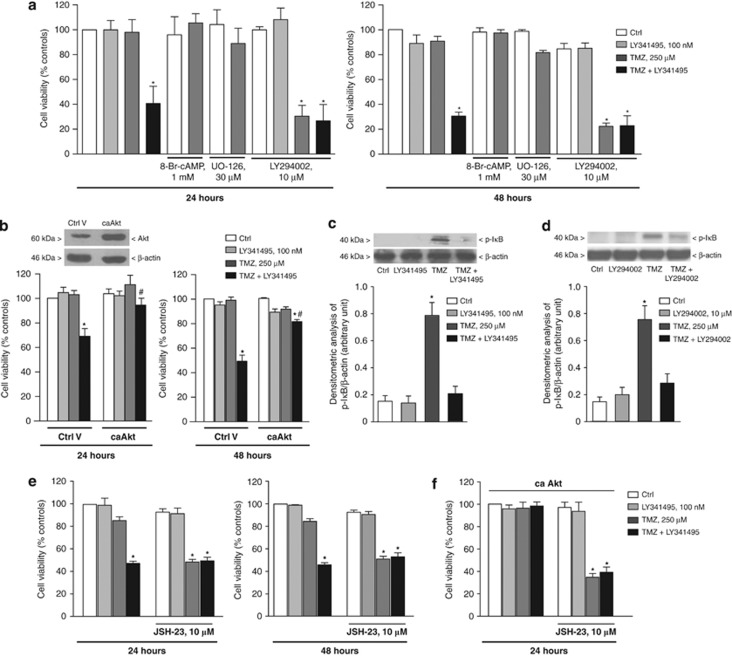
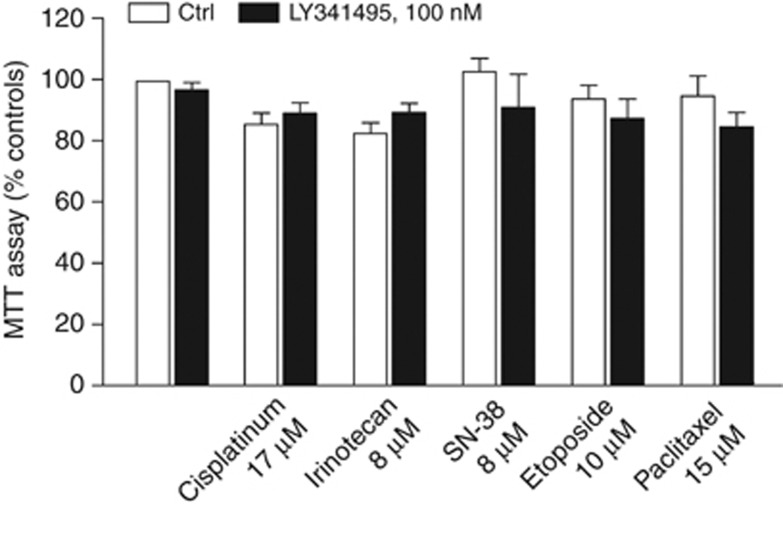
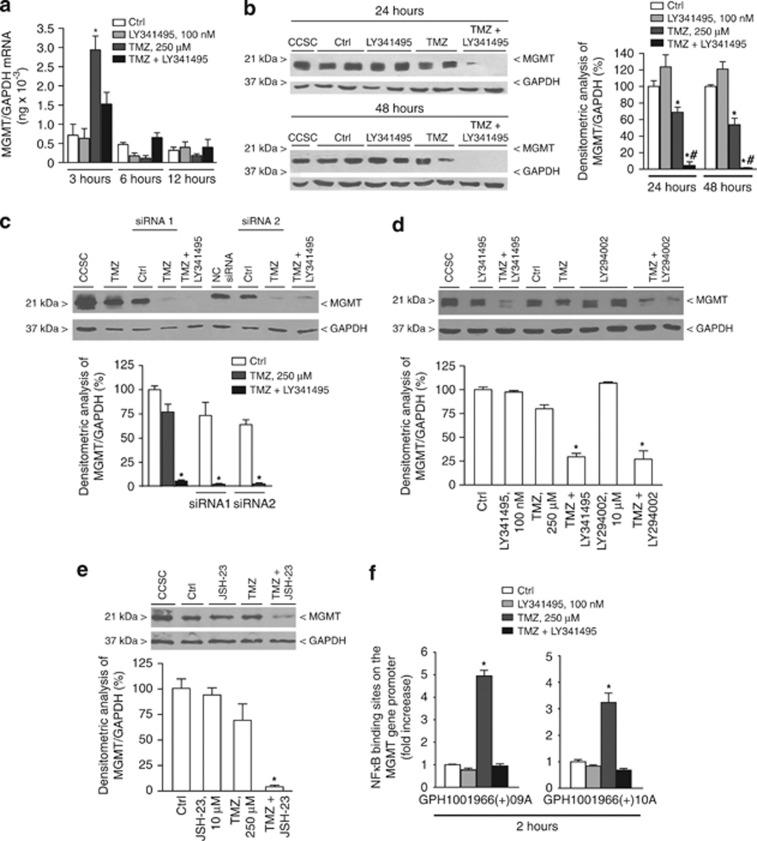
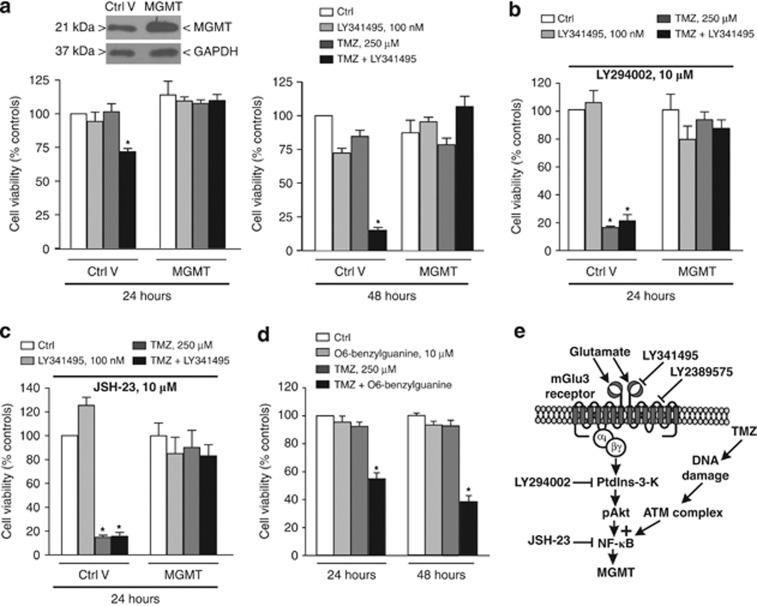
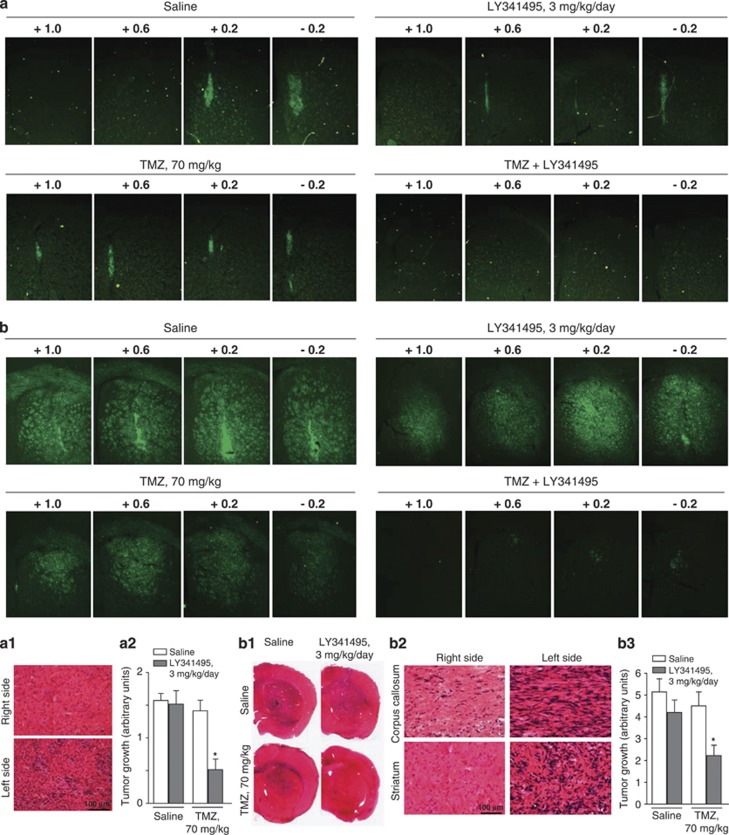
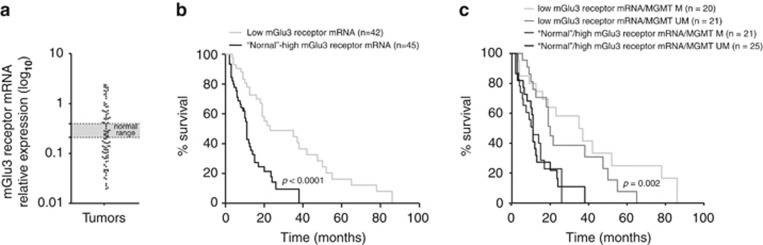
Drug treatment of malignant gliomas is limited by the intrinsic resistance of glioma stem cells (GSCs) to chemotherapy. GSCs isolated from human glioblastoma multiforme (GBM) expressed metabotropic glutamate receptors (mGlu3 receptors). The DNA-alkylating agent, temozolomide, killed GSCs only if mGlu3 receptors were knocked down or pharmacologically inhibited. In contrast, mGlu3 receptor blockade did not affect the action of paclitaxel, etoposide, cis-platinum, and irinotecan. mGlu3 receptor blockade enabled temozolomide toxicity by inhibiting a phosphatidylinositol-3-kinase/nuclear factor-κB pathway that supports the expression of O(6)-methylguanine-DNA methyltransferase (MGMT), an enzyme that confers resistance against DNA-alkylating agents. In mice implanted with GSCs into the brain, temozolomide combined with mGlu3 receptor blockade substantially reduced tumor growth. Finally, 87 patients with GBM undergoing surgery followed by adjuvant chemotherapy with temozolomide survived for longer time if tumor cells expressed low levels of mGlu3 receptors. In addition, the methylation state of the MGMT gene promoter in tumor extracts influenced survival only in those patients with low expression of mGlu3 receptors in the tumor. These data encourage the use of mGlu3 receptor antagonists as add-on drugs in the treatment of GBM, and suggest that the transcript of mGlu3 receptors should be measured in tumor specimens for a correct prediction of patients' survival in response to temozolomide treatment.


Figures

Figure 1
Figure 1
Expression of stem cell markers and tumorigenicity of GSCs isolated from clone E. Immunocytochemical analysis of Musashi1 and Sox-2 is shown in (a). Fluorescence staining is in green; DAPI, used as a counterstaining, is blue; phase-contrast microscopy is also shown. In vivo limiting dilution assay of GSCs implanted in the striatum of mice killed 3 months later is shown in (b). Representative images show the presence of 0.01, 0.05, 0.1, and 0.5 × 10⁶ GFP+ GSCs in the striatum of implanted mice
Figure 2
Figure 2
Human GSCs express functional mGlu3 receptors and their inhibition enables the cytotoxic action of temozolomide (TMZ). RT-PCR analysis of mGlu2 and mGlu3 receptor mRNA in control mouse brain tissue (cerebral cortex (Ctx)) and in all GSC clones (A–E) is shown in (a). Immunoblot analysis of mGlu2/3 receptors in shown in (b). We used an antibody that recognizes a C-terminus epitope common to mGlu2 and mGlu3 receptors. Inhibition of forskolin-stimulated cAMP formation by the mGlu2/3 receptor agonist, LY379268, in GSC clone ‘E' is shown in (c). Values are means±S.E.M. of 4–5 determinations. P<0.05 versus all other groups (one-way analysis of variance (ANOVA)+Tukey's t-test). Activation of the MAPK and the PtdIns-3-K pathways by LY379268 or mitogens in the absence or presence of LY341495 is shown in (d) and (e), respectively. Densitometric values are means±S.E.M. of four determinations. P<0.05 versus controls (Ctrl) (*), or versus the corresponding values obtained in the absence of LY341495 (#) (one-way ANOVA+Tukey's t-test). Phosphorylation of EFGR induced by EGF in the absence or presence of LY341495 is shown in (f). GSCs of clone E were starved for 24 h and then plated in 35 mm Petri dishes (106 cells per dish) and cultured without mitogens for 12 h. Afterwards, cells were challenged with EGF (10 ng/ml) and/or LY341495 (100 nM) for 30 min. Values are means±S.E.M. of four determinations. *P<0.05 (one-way ANOVA+Tukey's t-test) as compared with the corresponding values obtained in the absence of EGF. Toxicity was assessed in GSC of clone E treated with TMZ and/or the mGlu3 receptor antagonists, LY341495 and LY2389575. Data of the MTT assay are shown in (g, h). Values (means+S.E.M.) are expressed as percent of controls (Ctrl, no TMZ and no mGlu receptor ligands), and were calculated from the means of triplicates or quadruplicates from three to six individual culture preparations. *P<0.05 (one-way ANOVA+Tukey's t-test) versus the corresponding control values. Cytofluorimetric analysis of aneuploid DNA and lactate dehydrogenase (LDH) release are shown in (i) and (j), respectively. Values (means±S.E.M.) were calculated from three individual culture preparations. *P<0.05 (one-way ANOVA+Tukey's t-test) versus the respective control values or versus values obtained with LY341495 or TMZ alone. TMZ toxicity in GSCs deprived of mGlu3 receptors is shown in (k). mGlu3 receptor knockdown in response to small interfering RNA (siRNA) treatment is shown in the immunoblot. NC siRNA, non-coding siRNA. Values (means±S.E.M.) were calculated from three to four individual cultures. *P<0.05 (one-way ANOVA+Tukey's t-test) versus the respective controls
Figure 3
Figure 3
mGlu3 receptors restrain temozolomide (TMZ) toxicity by activating the PtdIns-3-K/Akt/NF-κB pathway. TMZ toxicity in GSCs treated w/wo LY341495, 8-bromo-cyclic AMP (8-Br-cAMP) or inhibitors of the MAPK and the PtdIns-3-K pathways is shown in (a). Values (means±S.E.M.) are expressed as percent of the first control bar (see legend of Figure 1) were calculated from three to four individual culture preparations. *P<0.05 (one-way analysis of variance (ANOVA)+Tukey's t-test) versus the respective controls (Ctrl). Data obtained with GSCs expressing a constitutively active form of Akt (caAkt) and treated with TMZ and/or LY341495 are shown in (b). The immunoblot shows the expression of Akt in GSC transfected with a control vector (Ctrl V) or with a vector encoding caAkt. Values (means±S.E.M.) were calculated from three individual culture preparations. P<0.05 (one-way ANOVA+Tukey's t-test) versus the respective controls (*) or versus TMZ+LY341495 (#). Phosphorylation of IκB in response to TMZ in the absence or presence of LY341495 or LY294002 is shown in (c) and (d), respectively. Values are means+S.E.M. from four determinations. *P<0.05 (one-way ANOVA+Tukey's t-test) versus the respective controls. The action of the NF-κB inhibitor, JSH-23, is shown in (e) and (f). In (f), GSCs were transfected with the vector encoding caAkt. Values (means+S.E.M.) were calculated from three individual culture preparations. *P<0.05 (one-way ANOVA+Tukey's t-test) versus the respective controls. UO-126, 1,4-diamino-2,3-dicyano-1,4-bis[2-aminophenylthio]butadiene
Figure 4
Figure 4
mGlu3 receptor blockade with LY341495 fails to influence the cytotoxic activity of non-alkylating anticancer drugs on GSCs. GSCs of clone E were treated for 48 h with cisplatinum, irinotecan, SN38, etoposide, and paclitaxel in the presence or absence (Ctrl) of LY341495. Values (means+S.E.M.) were calculated from four to six individual culture preparations
Figure 5
Figure 5
mGlu3 receptor blockade enables temozolomide (TMZ) toxicity by inhibiting MGMT expression in GSCs. Real-time PCR analysis of MGMT expression at three different times (3, 6, and 12 h) in cultured GSCs treated with LY341495 and TMZ alone or in combination is shown in (a). Values are means±S.E.M. of three determinations. *P<0.05 versus controls (Ctrl) (one-way analysis of variance (ANOVA)+Tukey's t-test). Western blot analysis of MGMT protein expression after administration of LY341495 and TMZ alone or in combination is shown in (b). Colon cancer stem cells (CCSCs) were used as positive controls for the expression of MGMT. Densitometric values are means±S.E.M. of three determinations. P<0.05 (one-way ANOVA+Tukey's t-test) versus the respective controls or LY341495 alone (*), or versus TMZ alone (#). MGMT protein levels after small interfering RNA (siRNA)-induced knockdown of mGlu3 receptors is shown in (c). Values are means±S.E.M. of three determinations. *P<0.05 (one-way ANOVA+Tukey's t-test) versus the respective controls. MGMT protein levels in GSCs treated with the PtdIns-3-K inhibitor, LY294002, or with the NF-κB inhibitor, JSH-23, are shown in (d) and (e), respectively. Values are means±S.E.M. of three to six determinations. *P<0.05 (one-way ANOVA+Tukey's t-test) versus the respective controls. NF-κB binding to MGMT promoter regions in GSCs treated with TMZ and/or LY341495 is shown in (f). Values are means±S.E.M. of nine determinations from three independent ChIP experiments. *P<0.05 (one-way ANOVA+Tukey's t-test) versus all other values. GAPDH, glyceraldehyde 3-phosphate dehydrogenase
Figure 6
Figure 6
Suppression of temozolomide (TMZ)-induced MGMT expression mediates the permissive role of mGlu3 receptor blockade on TMZ toxicity in GSCs treated with a control vector (Ctrl V) or with a vector encoding human MGMT and exposed to LY341495, LY294002, or JSH-23 is shown in (a), (b), and (c), respectively. Values (means+S.E.M.) are expressed as percent of the first control bar (see above) and were calculated from three individual culture preparations. *P<0.05 (one-way analysis of variance (ANOVA)+Tukey's t-test) versus the respective controls. TMZ toxicity in GSCs co-treated with the MGMT inhibitor, O6-benzylguanine, is shown in (d). Values (means+S.E.M.) were calculated from three individual culture preparations. *P<0.05 (one-way ANOVA+Tukey's t-test) versus the respective controls. A schematic model showing the mechanism by which activation of mGlu3 receptors supports TMZ-induced MGMT expression and restrains TMZ toxicity is shown in (e). ATM, Ataxia Telangiectasia Mutated; GAPDH, glyceraldehyde 3-phosphate dehydrogenase
Figure 7
Figure 7
Combined treatment with temozolomide (TMZ) and LY341495 inhibits tumor growth in mice implanted with GSCs into the brain parenchyma. In (a), (a1), and (a2), mice were implanted with osmotic minipumps releasing LY341495, 3 mg/kg per day for 28 days, 15 days after injection of GSCs into the left caudate nucleus. TMZ was injected intraperitoneally once daily every other day for 1 week starting from the day of minipump implantation. Mice were killed 30 days following minipump implantation (i.e. 45 days after GSC injection). Representative images showing the presence of GFP+ GSCs in the injection site are in (a). Numbers from +1.0 to −0.2 refer to the distance (in mm) from bregma. The histological features of the tumor are shown by hematoxylin/eosin staining in (a1). Data of tumor growth (see Materials and Methods for the scoring at 45 days) are shown in (a2). Values are means±S.E.M. of 8–10 mice per group. *P<0.05 (one-way analysis of variance (ANOVA)+Tukey's t-test) versus all other values. In (b), (b1), (b2), and (b3), experiments were carried out as in (a), with the difference that drug treatment started 45 days after GSC injection, and mice were killed 30 days later (75 days after GSC injection). Representative images of the injected site are shown in (b). The histology of the tumor is shown in (b1) and (b2). Data of tumor growth (see Materials and Methods for the scoring at 75 days) are shown in (b3), where data are means±S.E.M. of 6–8 mice per group. *P<0.05 (one-way ANOVA+Tukey's t-test) versus all other values
Figure 8
Figure 8
Inverse relation between tumor and mGlu3 receptor mRNA and OS in patients with GBM tumors treated with temozolomide. A scattered diagram plotting the mGlu3 receptor mRNA levels on GBM tumors (n=87) is shown in (a). A ‘normal' range is defined on the basis of values obtained from autoptic brains with no histological abnormalities (n=20). Kaplan–Meier survival curves of GBM patients stratified by tumor mGlu3 receptor mRNA expression alone or mGlu3 receptor mRNA expression combined with the methylation state of MGMT promoter is shown in (b) and (c), respectively. MGMT M, methylated promoter of the MGMT gene promoter; MGMT UM=unmethylated promoter

References

    1. Wen PY, Kesari S. Malignant glioma in adults. N Engl J Med. 2008;359:492–507. - PubMed
    1. Van Meir EG, Hadjipanayis CG, Norden AD, Shu HK, Wen PY, Olson JJ. Exciting new advances in neuro-oncology. The avenue to a cure for malignant glioma. CA Cancer J Clin. 2010;60:166–193. - PMC - PubMed
    1. Galli R, Binda E, Orfanelli U, Cipelletti B, Gritti A, De Vitis S, et al. Isolation and characterization of tumorigenic, stem-like neural precursors from human glioblastoma. Cancer Res. 2004;64:7011–7021. - PubMed
    1. Singh SK, Hawkins C, Clarke ID, Squire JA, Bayani J, Hide T, et al. Identification of human brain tumor initiating cells. Nature. 2004;18:396–401. - PubMed
    1. Vescovi AL, Galli R, Reynolds BA. Brain tumor stem cells. Nat Rev Cancer. 2006;6:425–436. - PubMed

MeSH terms