. 2013 Feb;87(3):1664-78.
doi: 10.1128/JVI.02782-12. Epub 2012 Nov 21.

Subcellular localization and function of an epitope-tagged p7 viroporin in hepatitis C virus-producing cells

Affiliations

Subcellular localization and function of an epitope-tagged p7 viroporin in hepatitis C virus-producing cells

Gabrielle Vieyres et al. J Virol. 2013 Feb.

Abstract

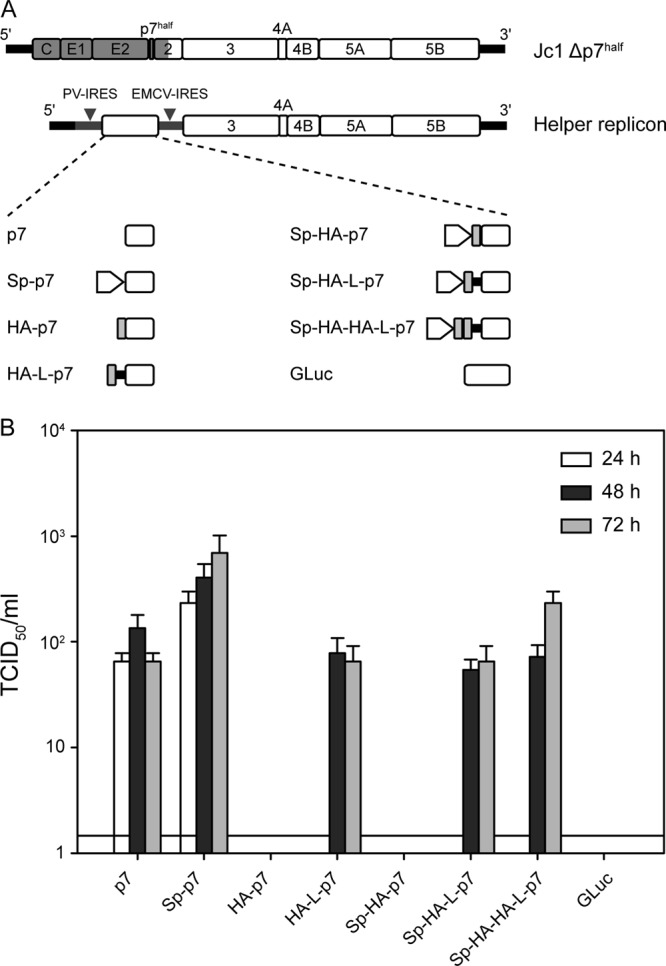
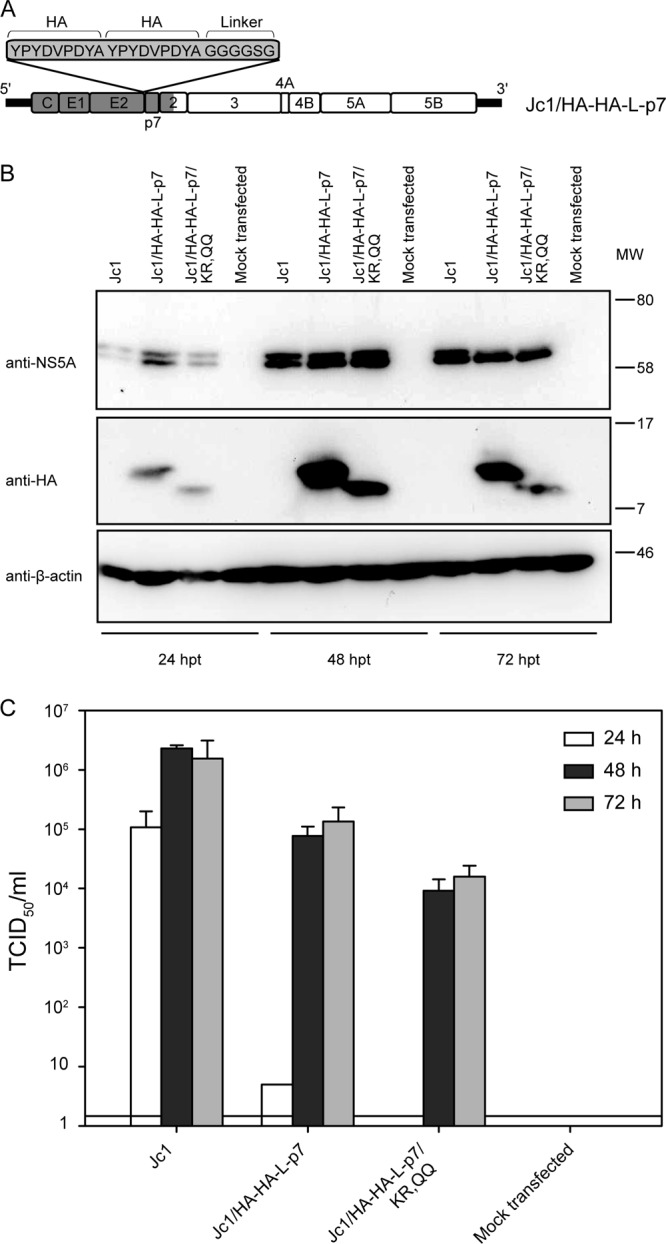
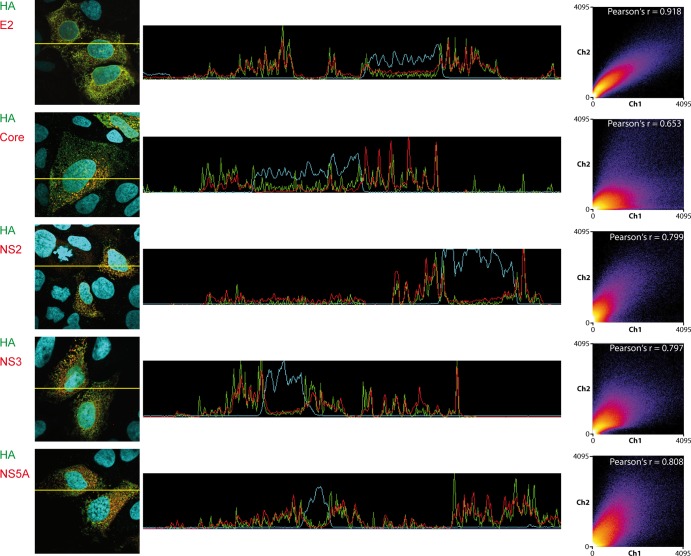
The hepatitis C virus (HCV) viroporin p7 is crucial for production of infectious viral progeny. However, its role in the viral replication cycle remains incompletely understood, in part due to the poor availability of p7-specific antibodies. To circumvent this obstacle, we inserted two consecutive hemagglutinin (HA) epitope tags at its N terminus. HA-tagged p7 reduced peak virus titers ca. 10-fold and decreased kinetics of virus production compared to the wild-type virus. However, HA-tagged p7 rescued virus production of a mutant virus lacking p7, thus providing formal proof that the tag does not disrupt p7 function. In HCV-producing cells, p7 displayed a reticular staining pattern which colocalized with the HCV envelope glycoprotein 2 (E2) but also partially with viral nonstructural proteins 2, 3, and 5A. Using coimmunoprecipitation, we confirmed a specific interaction between p7 and NS2, whereas we did not detect a stable interaction with core, E2, or NS5A. Moreover, we did not observe p7 incorporation into affinity-purified virus particles. Consistently, there was no evidence supporting a role of p7 in viral entry, as an anti-HA antibody was not able to neutralize Jc1 virus produced from an HA-p7-tagged genome. Collectively, these findings highlight a stable interaction between p7 and NS2 which is likely crucial for production of infectious HCV particles. Use of this functional epitope-tagged p7 variant should facilitate the analysis of the final steps of the HCV replication cycle.


Figures

Fig 1
Fig 1
HA-tagged p7 can rescue virus production of a p7-defective virus by trans-complementation. (A) Schematic representation of the HCV assembly-deficient p7 mutant genome (Jc1Δp7half) and the helper replicons used in this study. J6-derived genome segments are depicted in gray, JFH1 portions are shown as open boxes. The 5′ and 3′ nontranslated regions are given as black bars. (B) Titers of infectious particles released by cotransfection of the Jc1Δp7half and the helper replicon in Huh-7.5 cells. Titration was performed using the TCID50 method at 24, 48, and 72 h postelectroporation. Representative results of three independent experiments with error bars representing standard deviations are shown. The background level of the limiting dilution assay is indicated by a black line.
Fig 2
Fig 2
HA-tagged p7 is functional in the full-length infectious Jc1 virus. (A) Schematic representation of the Jc1/HA-HA-L-p7 construct. (B) Western blot analysis of NS5A, p7 (HA antibody), and actin expression in cell lysates at 24, 48, or 72 h postelectroporation with the indicated construct. (C) Titers of infectious particles released by transfection of the mentioned constructs. Titration was performed using the TCID50 method at 24, 48, and 72 h postelectroporation. Representative results of three independent experiments with error bars representing standard deviations are shown. The background level of the limiting dilution assay is indicated by a black line. MW, molecular weight (in thousands).
Fig 3
Fig 3
Subcellular localization of p7 relatively to cellular organelles. Huh-7.5 cells were fixed 48 h postinfection with Jc1/HA-HA-L-p7. For each staining combination, representative confocal images are shown in gray for the individual green and red channels and in color for the merged images (green, red, and blue channels, the latter representing DAPI staining of the cell nuclei). Areas highlighted with yellow boxes in the merged pictures are depicted at higher magnification in the rightmost column. Colocalization analyses of these pictures (profile intensity on a section of the picture, intensity scatter plot, and Pearson's coefficient) are presented in Fig. 5.
Fig 4
Fig 4
p7 colocalizes with E2 and nonstructural proteins in infected cells. Huh-7.5 cells were fixed 48 h postinfection with Jc1/HA-HA-L-p7. For each staining combination, representative confocal images are shown in gray for the individual green and red channels and in color for the merged images (green, red, and blue channel, the latter representing the DAPI staining of the cell nuclei). Areas highlighted with yellow boxes in the merged pictures are depicted at higher magnifications in the rightmost column. Colocalization analysis of these pictures (profile intensity on a section of the picture, intensity scatter plot, and Pearson's coefficient) are presented in Fig. 6.
Fig 5
Fig 5
Colocalization analysis of tagged p7 with cellular markers. Analysis was performed on the pictures showed in Fig. 3. The middle column shows signal intensity profiles for green, red, and blue (DAPI) channels along a section of the picture that is depicted in the left column. The right column represents frequency scatter plots of the intensity registered in the red and green channels. Note that this analysis was gated on the infected cells. Moreover, the HA signal is always shown on the x axis, whereas the y axis corresponds to the intensity of the second marker (e.g., Mitotracker, BODIPY, etc.). Individual dots in the scatter plot correspond to single pixels of the original picture. The color code highlights the frequency of dots present in a certain region of the scatter plot (from blue to yellow and white with increasing frequencies). Pearson's r coefficient of colocalization is indicated in the top right corner of the plot.
Fig 6
Fig 6
Colocalization analysis of tagged p7 with other viral proteins. Analysis was performed on the pictures showed in Fig. 5. Graphs are as described in the legend to Fig. 5, except that the scatter plot analysis and Pearson's coefficient calculation were performed on the whole picture, as both markers analyzed were detected only in infected cells.
Fig 7
Fig 7
p7 interacts with NS2 in HCV-producing cells. (A) NS2 coimmunoprecipitates with HA-tagged p7. Huh-7.5 cells were electroporated with Jc1 (−) or Jc1/HA-HA-L-p7 RNA (+). At 48 h posttransfection, cells were lysed, and immunoprecipitations with an anti-HA antibody or with a control isotype were performed. HA-tagged p7 and NS2 were detected in cell lysates (inputs) and in immunoprecipitates by Western blotting. In brief, proteins were revealed with a mixture of anti-HA and anti-NS2 mouse antibodies followed by detection with an anti-mouse IgG–horseradish peroxidase conjugate. The asterisks correspond to the immunoglobulins used for the immunoprecipitations (IPs) (from top to bottom, partially dissociated immunoglobulins, heavy and light chains). To improve p7 detection, Laemmli-containing protein samples were heated only to 37°C, which probably explains why part of the immunoglobulin heavy and light chains remained undissociated. (B) The p7 F26S mutation partially compensates for the core 69-72A defect in virus production. Titers of virus supernatants were determined using the TCID50 method at 24, 48, and 72 h after electroporation with the indicated constructs. Data are averages from 4 to 7 independent experiments, with error bars showing standard deviations. The background level of the limiting dilution assay is indicated as a black line. (C) The core 69-72A mutation does not affect p7/NS2 interaction. Immunoprecipitations and Western blot were performed as described for panel A, with lysates of cells electroporated with constructs 1 to 6 (numbering corresponds to panel B). MW, molecular weight (in thousands).
Fig 8
Fig 8
Absence of evidence for p7 incorporation in the HCV virion or role in entry. (A) The indicated viruses were incubated with anti-HA or anti-Flag antibodies prior to infection of cells. At 40 h postinfection, infectivity was evaluated by a focus-forming-unit assay. The residual infectivity relative to infectivity in the absence of antibody is shown. Means from 3 independent experiments, each containing 3 replicates, including standard deviations are shown. (B) Huh-7.5 cells were transfected with Jc1, Jc1/HA-HA-L-p7, Jc1/FlagE2 or Jc1/FlagE2/HA-HA-L-p7 RNA (respectively, lanes 1 to 4 in each part of the gel [inputs/control IgG/anti-HA/anti-Flag]). As a further control, Jc1 was prepared from Huh-7.5 cells expressing HA-ApoE (lane 5 in each part of the gel). Concentrated supernatants of the electroporated cells were either directly lysed and loaded on the gel (left) or subjected to immunoprecipitation with anti-HA antibodies or the relevant control isotype (middle) or an anti-Flag affinity matrix (right). Inputs and immunoprecipitated proteins were analyzed by Western blotting for p7 (anti-HA antibody; no signal detected), ApoE (anti-HA antibody), and core (C7-50 antibody) content. Arrowheads indicate detection of the core protein in the immunoprecipitates. The quantity of HCV core protein in each sample was also determined using a core-specific ELISA. Mean values and standard deviations from three independent experiments performed with independent virus stocks are given. MW, molecular weight (in thousands).

Similar articles

Cited by

References

    1. Nieva JL, Madan V, Carrasco L. 2012. Viroporins: structure and biological functions. Nat. Rev. Microbiol. 10:563–574 - PMC - PubMed
    1. Griffin SD, Beales LP, Clarke DS, Worsfold O, Evans SD, Jaeger J, Harris MP, Rowlands DJ. 2003. The p7 protein of hepatitis C virus forms an ion channel that is blocked by the antiviral drug, amantadine. FEBS Lett. 535:34–38 - PubMed
    1. Montserret R, Saint N, Vanbelle C, Salvay AG, Simorre JP, Ebel C, Sapay N, Renisio JG, Bockmann A, Steinmann E, Pietschmann T, Dubuisson J, Chipot C, Penin F. 2010. NMR structure and ion channel activity of the p7 protein from hepatitis C virus. J. Biol. Chem. 285:31446–31461 - PMC - PubMed
    1. Pavlovic D, Neville DC, Argaud O, Blumberg B, Dwek RA, Fischer WB, Zitzmann N. 2003. The hepatitis C virus p7 protein forms an ion channel that is inhibited by long-alkyl-chain iminosugar derivatives. Proc. Natl. Acad. Sci. U. S. A. 100:6104–6108 - PMC - PubMed
    1. Premkumar A, Wilson L, Ewart GD, Gage PW. 2004. Cation-selective ion channels formed by p7 of hepatitis C virus are blocked by hexamethylene amiloride. FEBS Lett. 557:99–103 - PubMed

Publication types

Substances

LinkOut - more resources