

Ag nanorod based surface-enhanced Raman spectroscopy applied to bioanalytical sensing
- PMID: 23175392
- PMCID: PMC3767285
- DOI: 10.1002/jbio.201200133
Ag nanorod based surface-enhanced Raman spectroscopy applied to bioanalytical sensing
Abstract
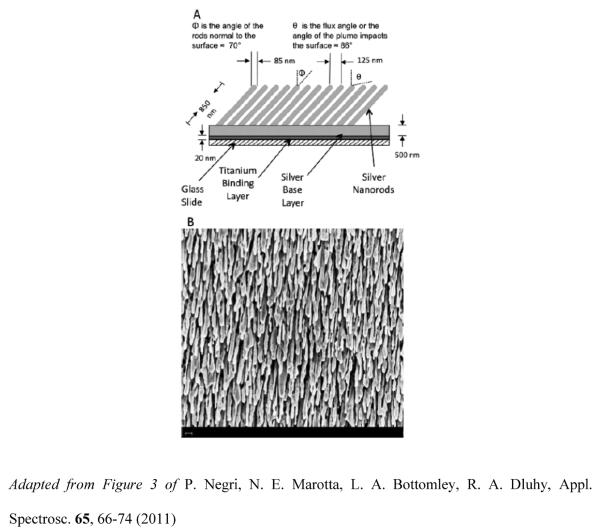
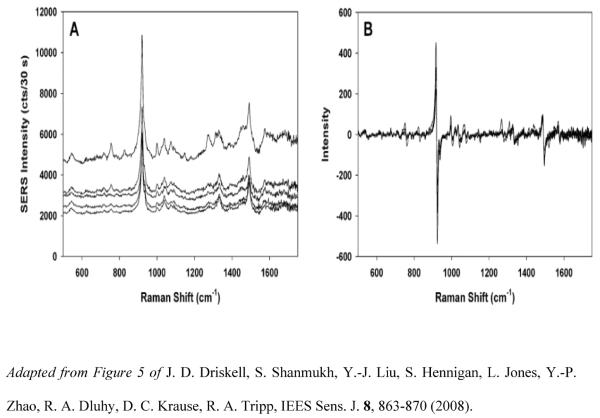
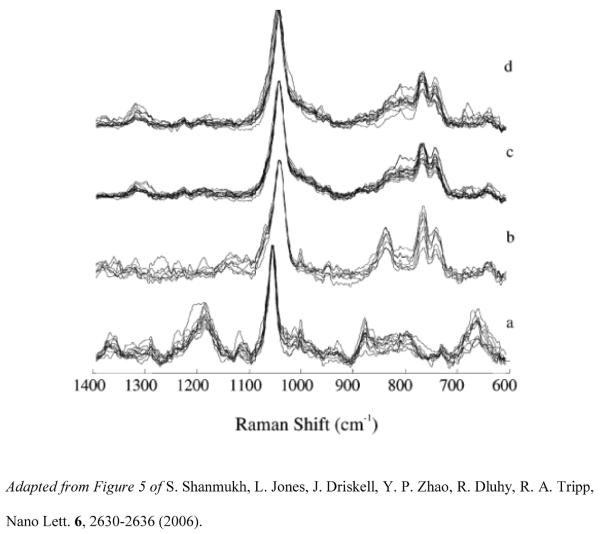
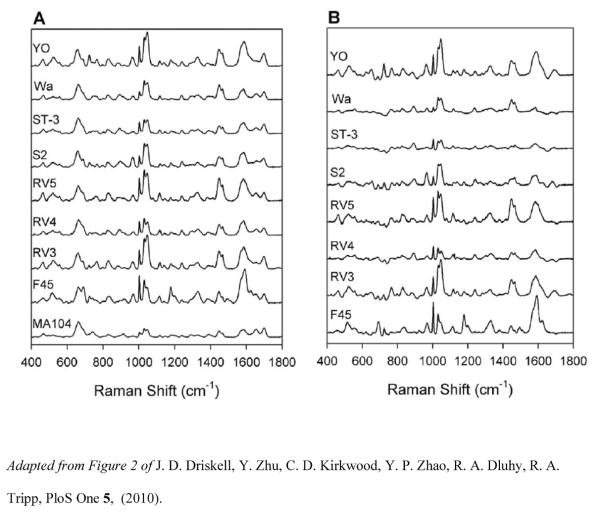
Recent progress in substrate nanofabrication has led to the development of Ag nanorod arrays as uniform, reproducible, large area SERS-active substrates with high signal enhancement. These novel nanostructures fabricated by oblique angle vapor deposition (OAD) offer a robust platform for the rapid detection of biological agents and open new perspectives for the development and integration of biomedical diagnostic for clinical and therapeutic applications. Ag nanorod arrays have been investigated as SERS-active substrates for the detection and identification of pathogens, including bacteria and viruses, as well as to evaluate the potential of this biosensing platform for bio-recognition of high affinity events using oligonucleotide-modified substrates. This review summarizes the various nanostructured substrates designed for SERS-based applications, highlights the nanofabrication methodology used to produce Ag nanorod arrays, outlines their morphological and physical properties, and provides a summary of the most recent uses of these substrates for clinical diagnostic and biomedical applications.
Copyright © 2013 WILEY-VCH Verlag GmbH & Co. KGaA, Weinheim.
Figures
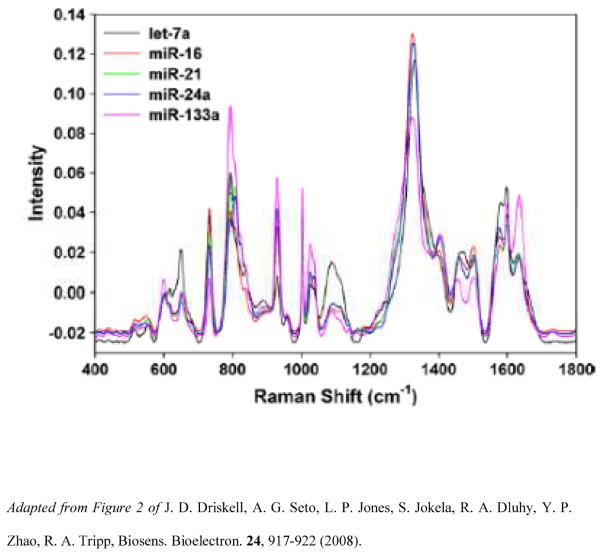
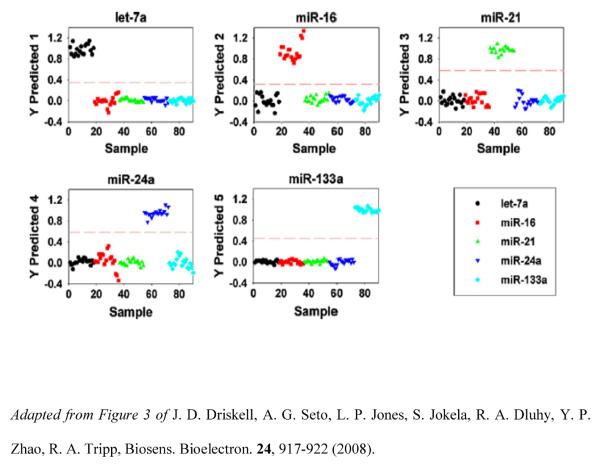
 ), miR-21 (
 ), miR-24a (
 ), and miR-133a (◇).
References
-
- Hering K, Cialla D, Ackermann K, Dorfer T, Moller R, Schneidewind H, Mattheis R, Fritzsche W, Rosch P, Popp J. Anal Bioanal Chem. 2008;390:113–124. - PubMed
-
- Kneipp K, Kneipp H, Itzkan I, Dasari RR, Feld MS. Curr. Sci. 1999;77:915–924.
-
- Vo-Dinh T, Yan F, Wabuyele MB. J Raman Spectrosc. 2005;36:640–647.
-
- Kneipp K, Kneipp H, Itzkan I, Dasari RR, Feld MS. J. Phys.-Condens. Mat. 2002;14:R597–R624.
Publication types
MeSH terms
Substances
Grants and funding
LinkOut - more resources
Full Text Sources
Miscellaneous
