

Kinetics of intravenous radiographic contrast medium injections as used on CT: simulation with time delay differential equations in a basic human cardiovascular multicompartment model
- PMID: 23175487
- PMCID: PMC3611726
- DOI: 10.1259/bjr/83724929
Kinetics of intravenous radiographic contrast medium injections as used on CT: simulation with time delay differential equations in a basic human cardiovascular multicompartment model
Abstract
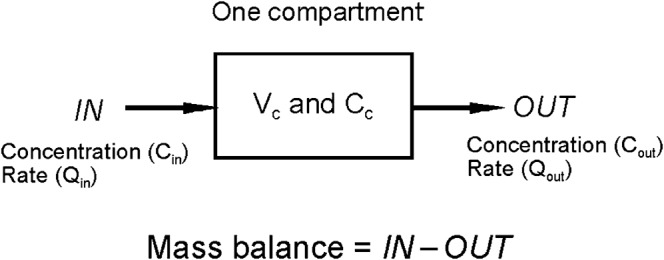
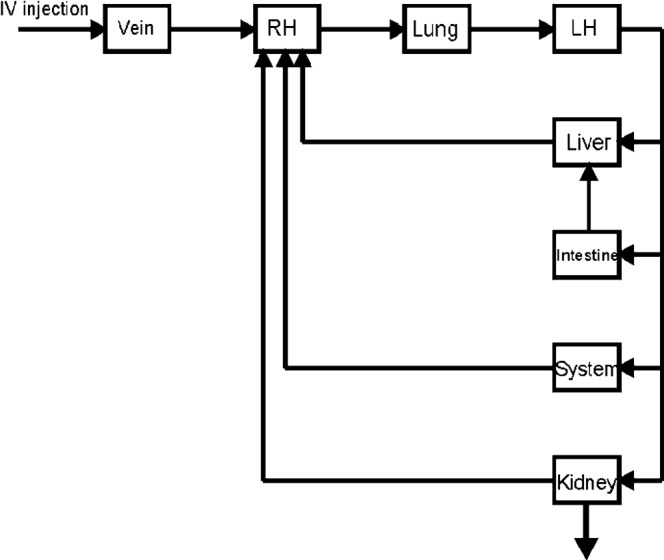
Objectives: To develop a multicompartment model of only essential human body components that predicts the contrast medium concentration vs time curve in a chosen compartment after an intravenous injection. Also to show that the model can be used to time adequately contrast-enhanced CT series.
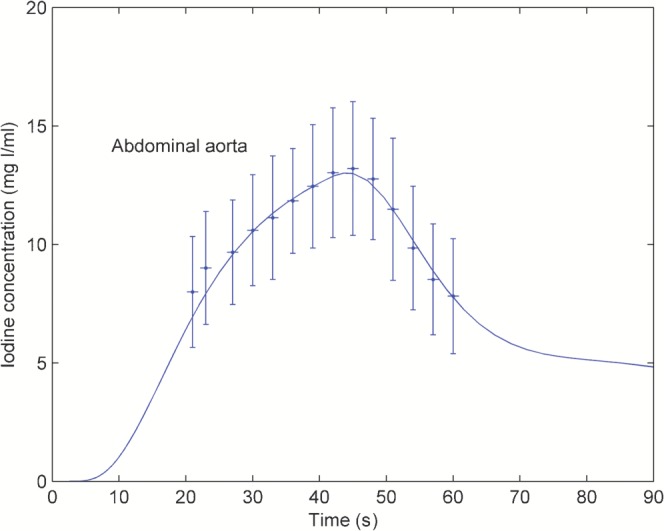
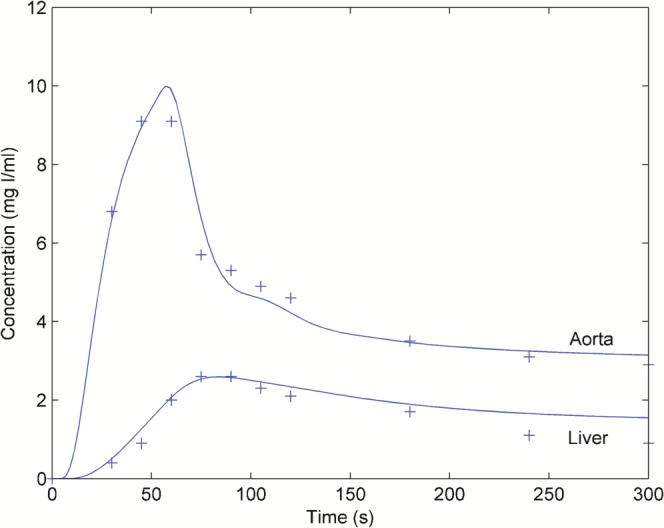
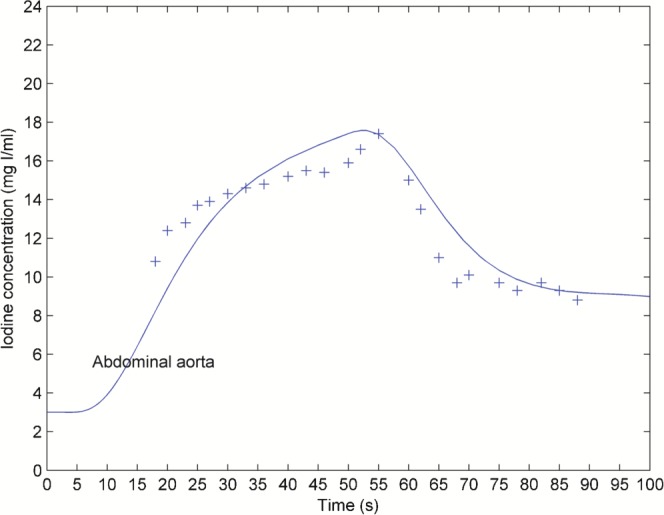
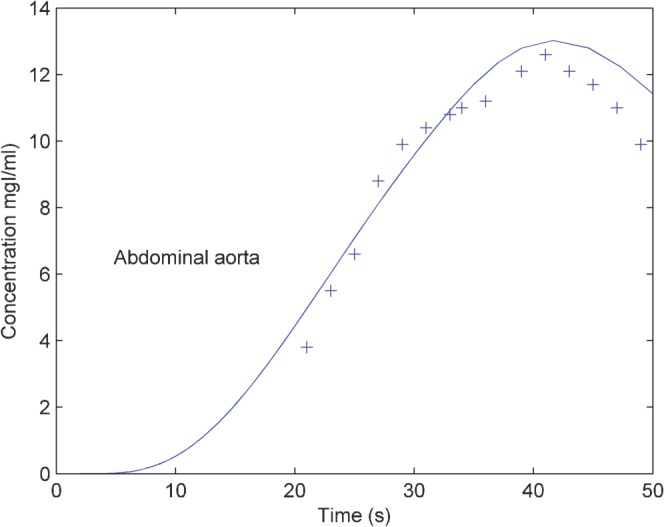
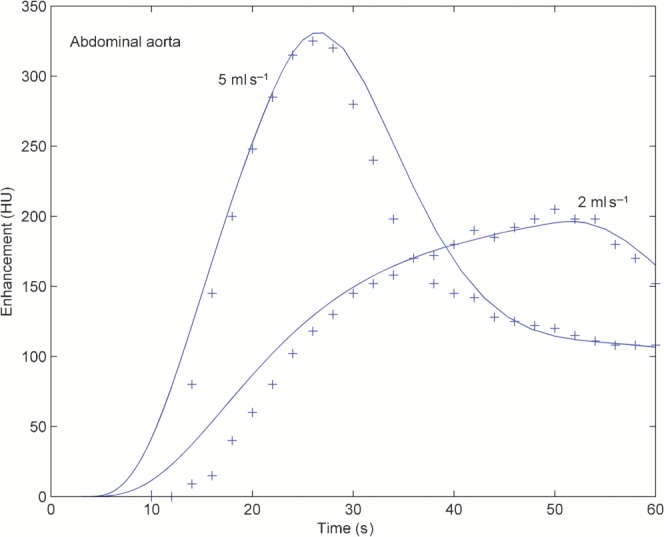
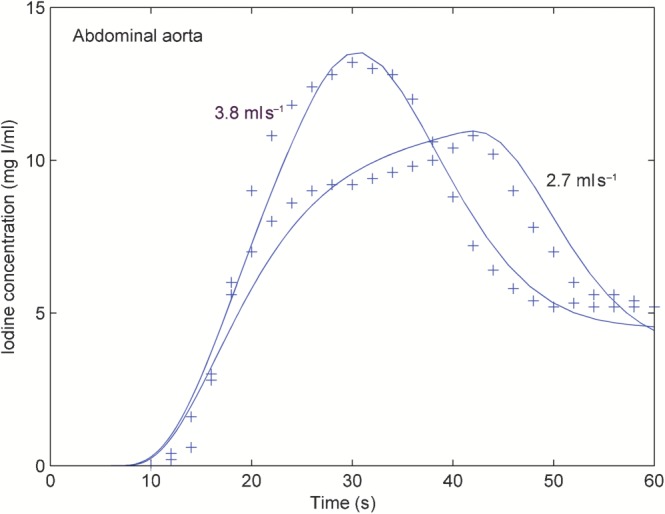
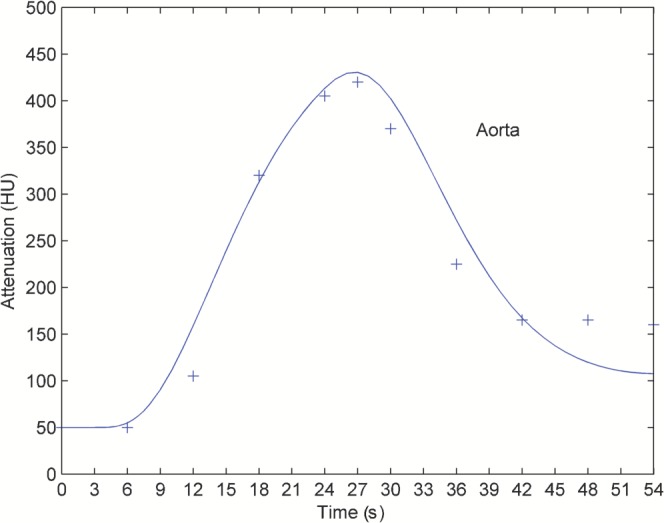
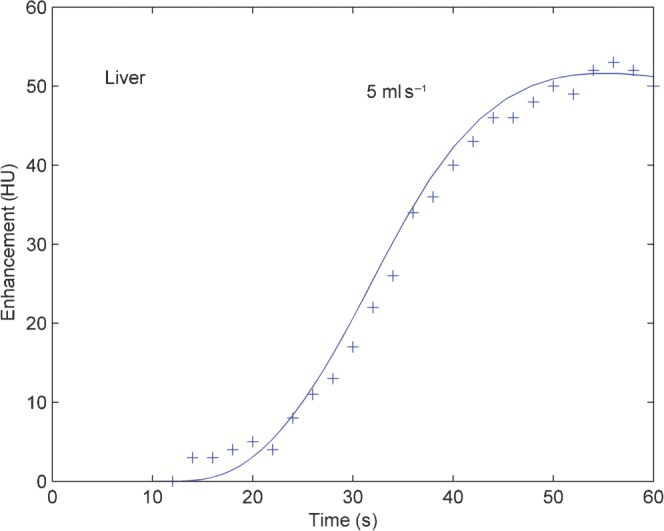
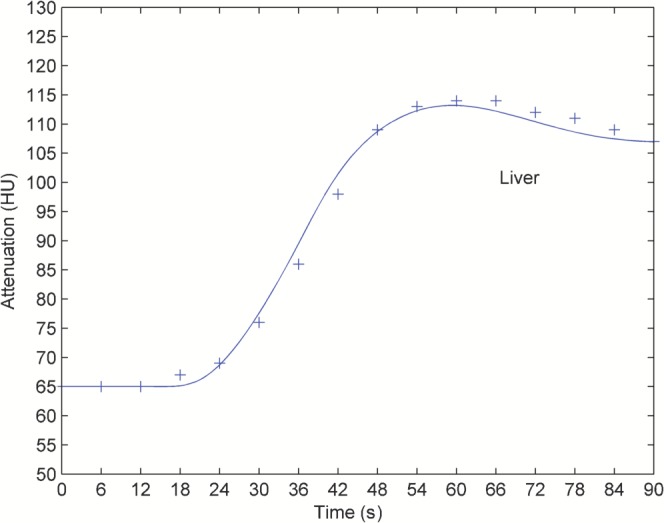
Methods: A system of linked time delay instead of ordinary differential equations described the model and was solved with a Matlab program (Matlab v. 6.5; The Mathworks, Inc., Natick, MA). All the injection and physiological parameters were modified to cope with normal or pathological situations. In vivo time-concentration curves from the literature were recalculated to validate the model.
Results: The recalculated contrast medium time-concentration curves and parameters are given. The results of the statistical analysis of the study findings are expressed as the median prediction error and the median absolute prediction error values for both the time delay and ordinary differential equation systems; these are situated well below the generally accepted maximum 20% limit.
Conclusion: The presented program correctly predicts the time-concentration curve of an intravenous contrast medium injection and, consequently, allows an individually tailored approach of CT examinations with optimised use of the injected contrast medium volume, as long as time delay instead of ordinary differential equations are used.
Advances in knowledge: The presented program offers good preliminary knowledge of the time-contrast medium concentration curve after any intravenous injection, allowing adequate timing of a CT examination, required by the short scan time of present-day scanners. The injected volume of contrast medium can be tailored to the individual patient with no more contrast medium than is strictly needed.
Figures
References
-
- Fleischmann D. Present and future trends in multiple detector-row CT applications: CT angiography. Eur Radiol 2002;12Suppl. 2:s11–15 - PubMed
-
- Fleischmann D. How to design injection protocols for multiple-row CT angiography (MDCTA). Eur Radiol Suppl 2005;15Suppl. 5:e60–5 - PubMed
-
- Bae KT, Heiken JP, Brink JA. Aortic and hepatic contrast medium enhancement at CT. Part I. Prediction with a computer model. Radiology 1998;207:647–55 - PubMed
-
- Bae KT, Heiken JP, Brink JA. Aortic and hepatic peak enhancement at CT: effect of contrast medium injection rate. Pharmacokinetic analysis and experimental porcine model. Radiology 1998;206:455–64 - PubMed
-
- Gibaldi M, Perrier D. Pharmacokinetics. 2nd edn. New York, NY: Marcel Dekker, Inc.; 1982
