. 2012 Nov;24(11):4465-82.
doi: 10.1105/tpc.112.102566. Epub 2012 Nov 21.

Protein-protein and protein-membrane associations in the lignin pathway

Affiliations

Protein-protein and protein-membrane associations in the lignin pathway

Jean-Etienne Bassard et al. Plant Cell. 2012 Nov.

Abstract

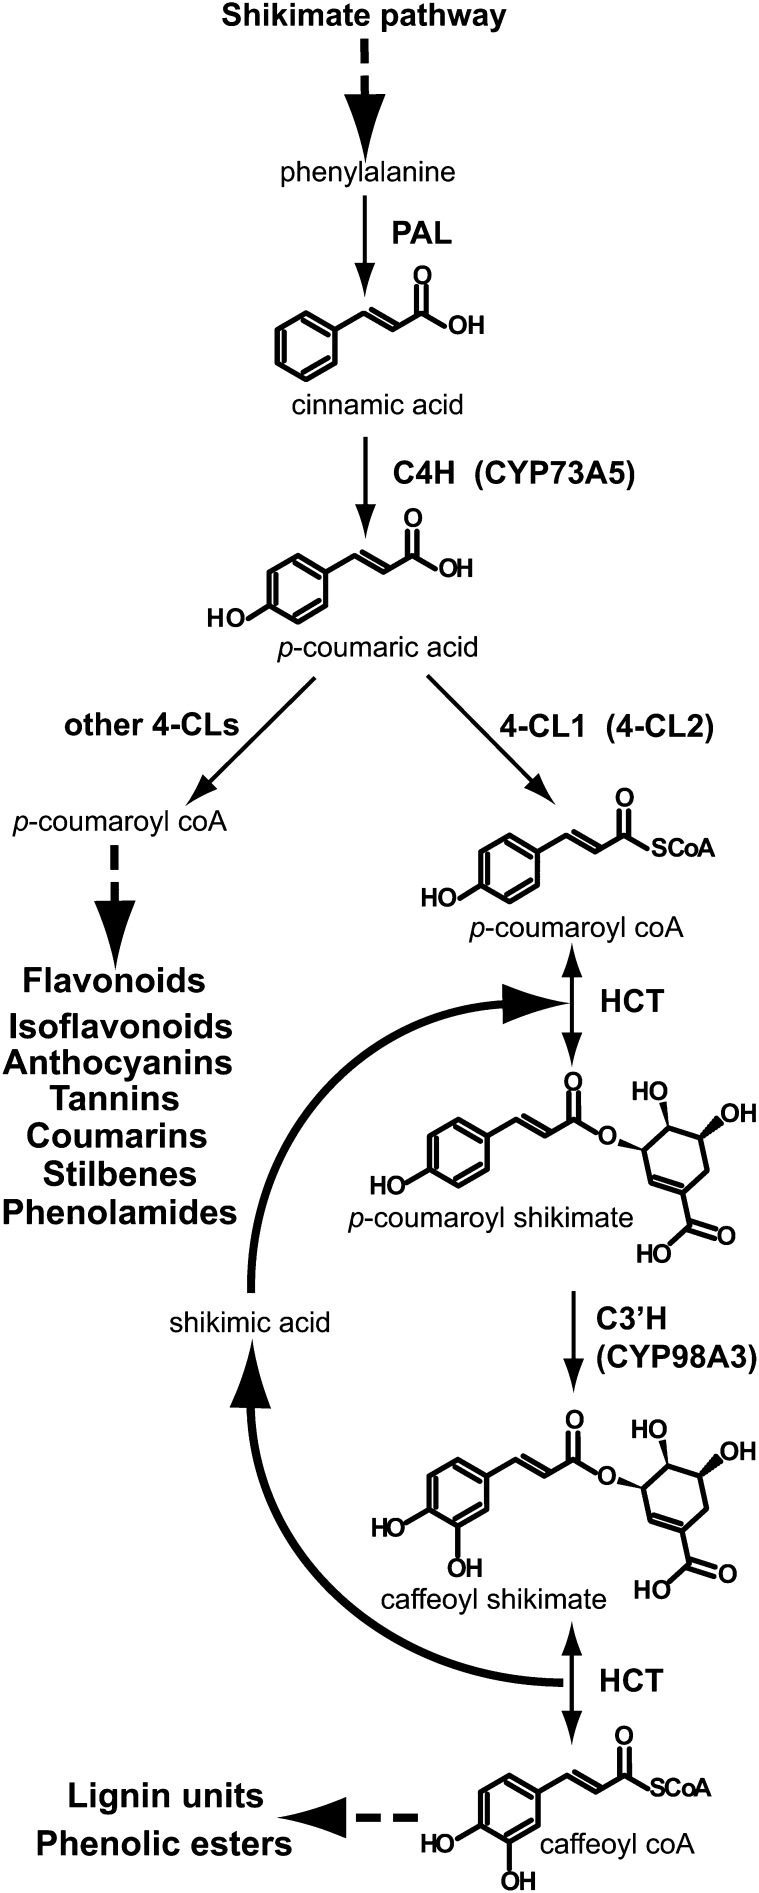
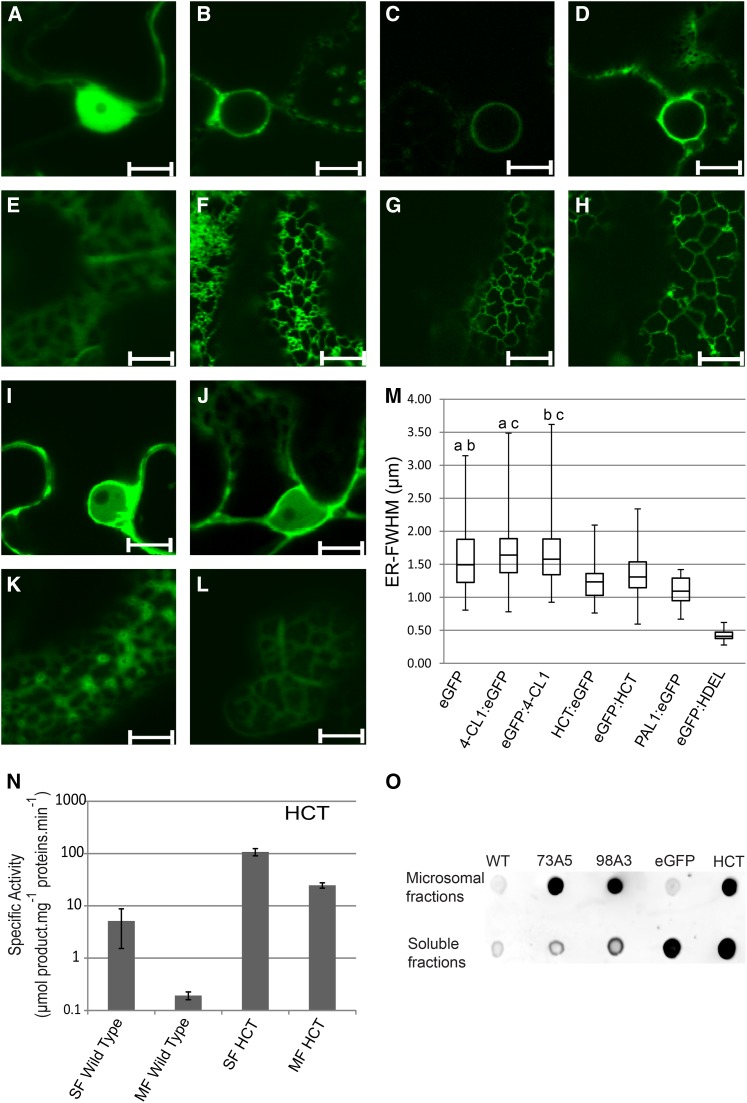
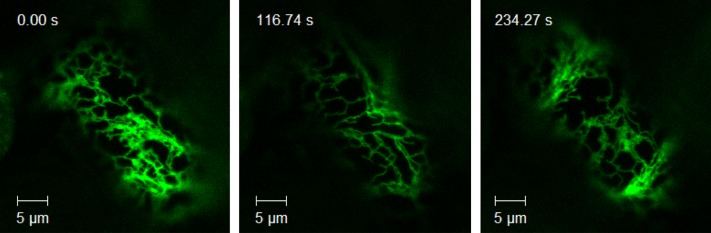
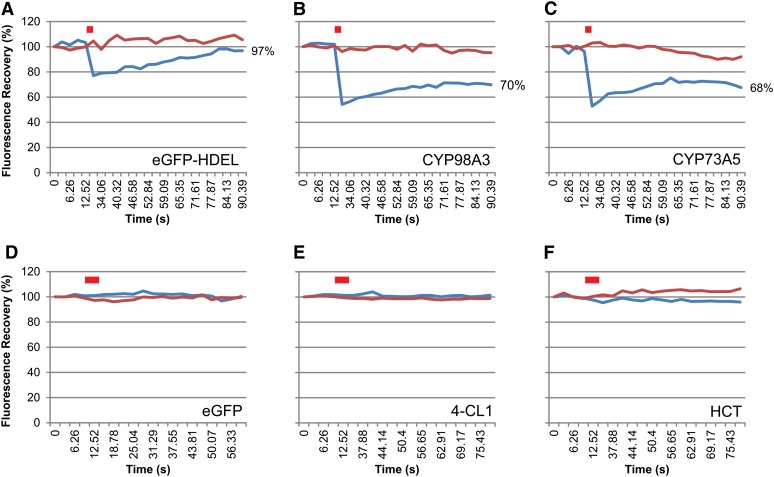
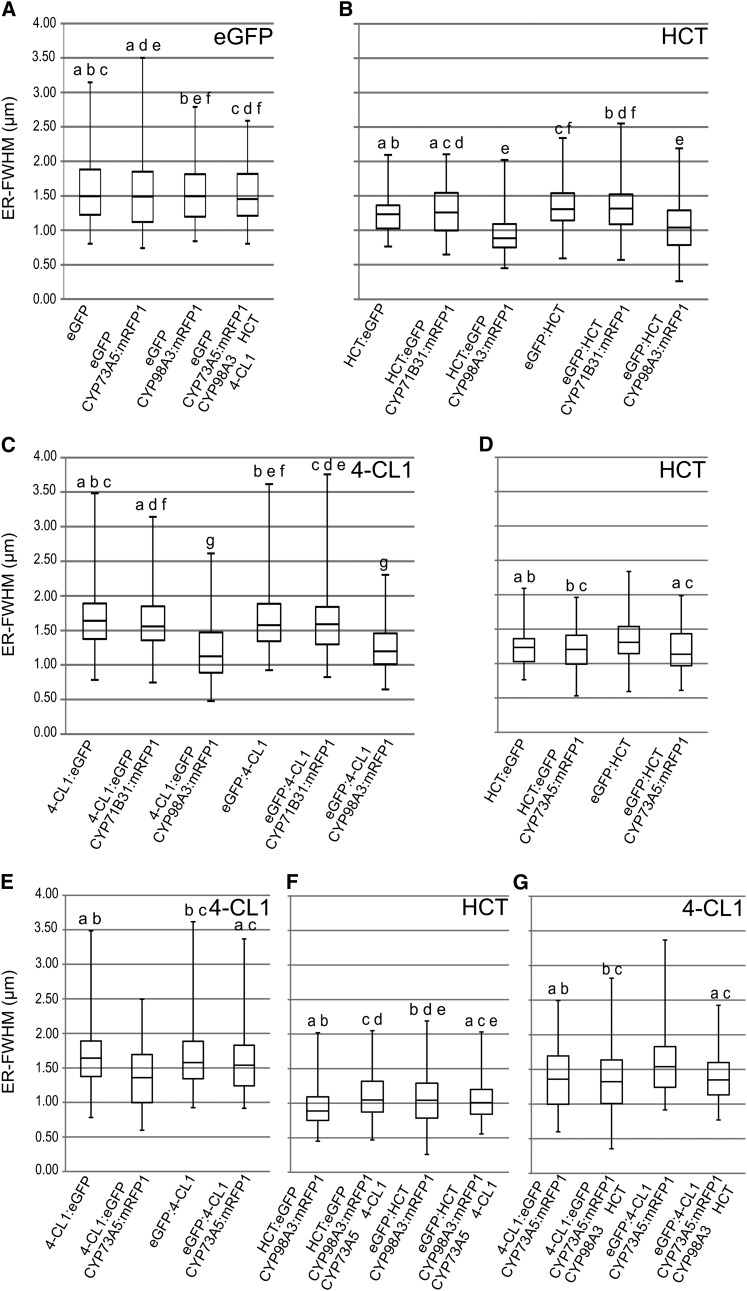
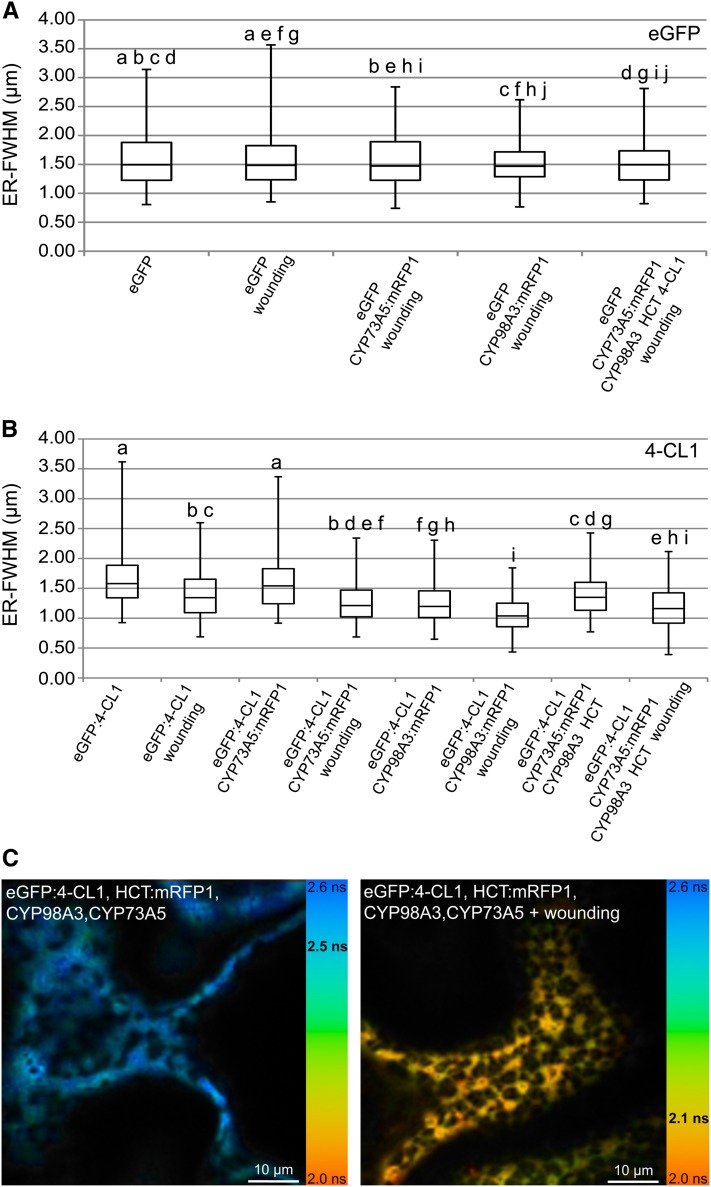
Supramolecular organization of enzymes is proposed to orchestrate metabolic complexity and help channel intermediates in different pathways. Phenylpropanoid metabolism has to direct up to 30% of the carbon fixed by plants to the biosynthesis of lignin precursors. Effective coupling of the enzymes in the pathway thus seems to be required. Subcellular localization, mobility, protein-protein, and protein-membrane interactions of four consecutive enzymes around the main branch point leading to lignin precursors was investigated in leaf tissues of Nicotiana benthamiana and cells of Arabidopsis thaliana. CYP73A5 and CYP98A3, the two Arabidopsis cytochrome P450s (P450s) catalyzing para- and meta-hydroxylations of the phenolic ring of monolignols were found to colocalize in the endoplasmic reticulum (ER) and to form homo- and heteromers. They moved along with the fast remodeling plant ER, but their lateral diffusion on the ER surface was restricted, likely due to association with other ER proteins. The connecting soluble enzyme hydroxycinnamoyltransferase (HCT), was found partially associated with the ER. Both HCT and the 4-coumaroyl-CoA ligase relocalized closer to the membrane upon P450 expression. Fluorescence lifetime imaging microscopy supports P450 colocalization and interaction with the soluble proteins, enhanced by the expression of the partner proteins. Protein relocalization was further enhanced in tissues undergoing wound repair. CYP98A3 was the most effective in driving protein association.


Figures

Figure 1.
Figure 1.
Lignin Branch Point of Phenolic Metabolism. Dashed arrows indicate multistep reactions.
Figure 2.
Figure 2.
Subcellular Localization of 4-CL1, HCT, CYP73A5, and CYP98A3. Confocal images, microsomes, and soluble fractions were collected 5 d after agroinfiltration of the N. benthamiana leaves. (A) to (L) Confocal Laser Scanning Microscopy (CLSM) images of the nucleus ([A] to [D], [I], and [J]) and parietal ER ([E] to [H], [K], and [L]) of leaves expressing eGFP ([A] and [E]), eGFP:HDEL ([B] and [F]), CYP73A5:eGFP ([C] and [G]), CYP98A3:eGFP ([D] and [H]), 4-CL1:eGFP ([I] and [K]), or HCT:eGFP ([J] and [L]). Soluble enzymes diffuse into the nucleus and fill in gaps between organelles and plasma membranes. ER proteins are confined to nuclear membranes and to a well-defined membrane network. 4-CL1:eGFP and HCT:eGFP localization usually appears less diffuse than eGFP on confocal images. Latrunculin B (20 µM) was used to stop the movement of the ER. Similar images were obtained with mRFP1 fusion constructs or N-terminal fluorescent fusion constructs for HCT and 4-CL1. Bars = 10 µm. (M) Box plot representing the distribution of HCT, 4-CL1, eGFP, NtPAL1:eGFP, and eGFP:HDEL detected by CLSM around ER tubules evaluated by confocal microscopy based on confocal images such as those shown in (E), (F), (K), and (L). The box plot representation provides information on the distribution of a population of proteins near the membrane (median, maximum, and minimum distances, as well as first and third quartile). For each experimental condition, 100 measurements were randomly recorded from independent images. a, b, and c indicate pairs with similar distribution according to ANOVA analysis (see Supplemental Data Set 2 online). ER-FWHM, ER-full width at half maximum expressed in micrometers. The box plot shows the median distance and the protein located farther (above) or closer (below) to the membrane. (N) HCT activities detected in the soluble fraction and associated with washed microsomal membranes. Specific activities are expressed in µmol of product per milligram of total proteins per minute. MF, microsomal fraction; SF, soluble fraction. Mean and sd (indicated by error bars) are determined from three independent experiments and three technical replicates. See Supplemental Table 1 online for details on eGFP-fusion enzyme activities. (O) Dot blot of soluble fractions or microsomes from N. benthamiana plants expressing eGFP-tagged proteins detected by eGFP antibodies. WT, the wild type N. benthamiana (control); eGFP, eGFP alone (control); 73A5, CYP73A5:eGFP; 98A3, CYP98A3:eGFP; HCT, HCT:eGFP.
Figure 3.
Figure 3.
Mobility of CYP98A3 with the Plant ER. Five days after agroinfiltration of N. benthamiana leaves with the CYP98A3:eGFP construct, movies of the GFP fluorescence were taken. Representative images from three times as indicated are shown. The full movie is available as Supplemental Movie 1 online. Movies showing the behavior of eGFP (soluble enzyme control) and eGFP:HDEL (ER protein control) are available for comparison as Supplemental Movies 2 and 3 online. Bar = 5 µm.
Figure 4.
Figure 4.
FRAP. FRAP experiments were performed 5 d after agroinfiltration of N. benthamiana leaves with eGFP-HDEL (or ER-anchored eGFP) (A), CYP98A3:eGFP (B), CYP73A5:eGFP (C), eGFP (D), 4-CL1:eGFP (E), and HCT:eGFP (F) constructs. Latrunculin B (20 µM) was used to stop the movement of the ER tubules. Red bar indicates bleaching. Blue and red lines represent fluorescence recorded in bleached and control areas, respectively, for one representative experiment. See Supplemental Figure 1 for details about FRAP statistics.
Figure 5.
Figure 5.
Distribution of HCT and 4-CL1 around ER Tubules Detected by CLSM. Confocal images were recorded 5 d after agroinfiltration of the N. benthamiana leaves. Box plots are shown. For each experimental condition, 100 measurements were randomly recorded from independent images. a, b, c, d, e, and f indicate pairs with similar distribution according to ANOVA analysis (see Supplemental Data Set 2 online). ER-FWHM, ER-full width at half maximum expressed in micrometers. See Supplemental Figure 4 online for dot blot confirmation of protein expression and Supplemental Figure 5 online for comparison of the expression of the CYP71B31, CYP98A3, and CYP73A5 constructs. (A) Distribution of eGFP (control). (B) Distribution of HCT coexpressed with CYP98A3 or CYP71B31 (negative control). (C) Distribution of 4-CL1 coexpressed with CYP98A3 or CYP71B31 (negative control). (D) Distribution of HCT coexpressed with CYP73A5. (E) Distribution of 4-CL1 coexpressed with CYP73A5. (F) Distribution of HCT when coexpressed with the three other enzymes. (G) Distribution of 4-CL1 when coexpressed with the three other enzymes.
Figure 6.
Figure 6.
Effect of Wounding on Fluorescence Lifetime Values and Relocalization of Soluble Proteins. (A) Box plot comparing distribution of eGFP (control) in the wound-healing zone upon coexpression of proteins of interest. (B) Box plot comparing distribution of 4-CL1 in the wound-healing zone upon coexpression of partner proteins. For each experimental condition, 100 measurements were randomly recorded from independent images. a, b, c, d, e, f, g, h, i, and j indicate pairs significantly similar according to ANOVA analysis. See Supplemental Data Set 2 online for details about ANOVA results. ER-FWHM, ER-full width at half maximum expressed in micrometers. The transfected leaves were wounded with a nail board 3 h before acquisition of the images in the healing zone. (C) Effect of wounding on protein–protein interactions. Images were recorded 5 d after agroinfiltration of the N. benthamiana leaves. Fluorescence lifetime images acquired by FLIM are pseudo-colorized according to the color code ranging from 2.0 ns (orange) to 2.6 ns (light blue). The mean lifetime value measured in the image is indicated in bold black on the color scale. Bars = 10 µm. See Supplemental Figure 2 online for details about relocalization analysis procedure, HCT relocalization, and FLIM after wounding.

References

    1. Achnine L., Blancaflor E.B., Rasmussen S., Dixon R.A. (2004). Colocalization of L-phenylalanine ammonia-lyase and cinnamate 4-hydroxylase for metabolic channeling in phenylpropanoid biosynthesis. Plant Cell 16: 3098–3109 - PMC - PubMed
    1. Azoulay J., Clamme J.P., Darlix J.L., Roques B.P., Mély Y. (2003). Destabilization of the HIV-1 complementary sequence of TAR by the nucleocapsid protein through activation of conformational fluctuations. J. Mol. Biol. 326: 691–700 - PubMed
    1. Backes W.L., Kelley R.W. (2003). Organization of multiple cytochrome P450s with NADPH-cytochrome P450 reductase in membranes. Pharmacol. Ther. 98: 221–233 - PubMed
    1. Bassard J.-E., Mutterer J., Duval F., Werck-Reichhart D. (2012). A novel method for monitoring the localization of cytochromes P450 and other endoplasmic reticulum membrane associated proteins: A tool for investigating the formation of metabolons. FEBS J. 279: 1576–1583 - PubMed
    1. Bayburt T.H., Sligar S.G. (2002). Single-molecule height measurements on microsomal cytochrome P450 in nanometer-scale phospholipid bilayer disks. Proc. Natl. Acad. Sci. USA 99: 6725–6730 - PMC - PubMed

Publication types

MeSH terms