

Tuning ion correlations at an electrified soft interface
- PMID: 23175787
- PMCID: PMC3528511
- DOI: 10.1073/pnas.1214204109
Tuning ion correlations at an electrified soft interface
Abstract
Ion distributions play a central role in various settings-from biology, where they mediate the electrostatic interactions between charged biomolecules in solution, to energy storage devices, where they influence the charging properties of supercapacitors. These distributions are determined by interactions dictated by the chemical properties of the ions and their environment as well as the long-range nature of the electrostatic force. Recent theoretical and computational studies have explored the role of correlations between ions, which have been suggested to underlie a number of counterintuitive results, such as like-charge attraction. However, the interdependency between ion correlations and other interactions that ions experience in solution complicates the connection between physical models of ion correlations and the experimental investigation of ion distributions. We exploit the properties of the liquid/liquid interface to vary the coupling strength of ion-ion correlations from weak to strong while monitoring their influence on ion distributions at the nanometer scale with X-ray reflectivity and the macroscopic scale with interfacial tension measurements. These data are in agreement with the predictions of a parameter-free density functional theory that includes ion-ion correlations and ion-solvent interactions over the entire range of experimentally tunable correlation coupling strengths (from 0.8 to 3.7). This study provides evidence for a sharply defined electrical double layer for large coupling strengths in contrast to the diffuse distributions predicted by mean field theory, thereby confirming a common prediction of many ion correlation models. The reported findings represent a significant advance in elucidating the nature and role of ion correlations in charged soft matter.
Conflict of interest statement
The authors declare no conflict of interest.
Figures
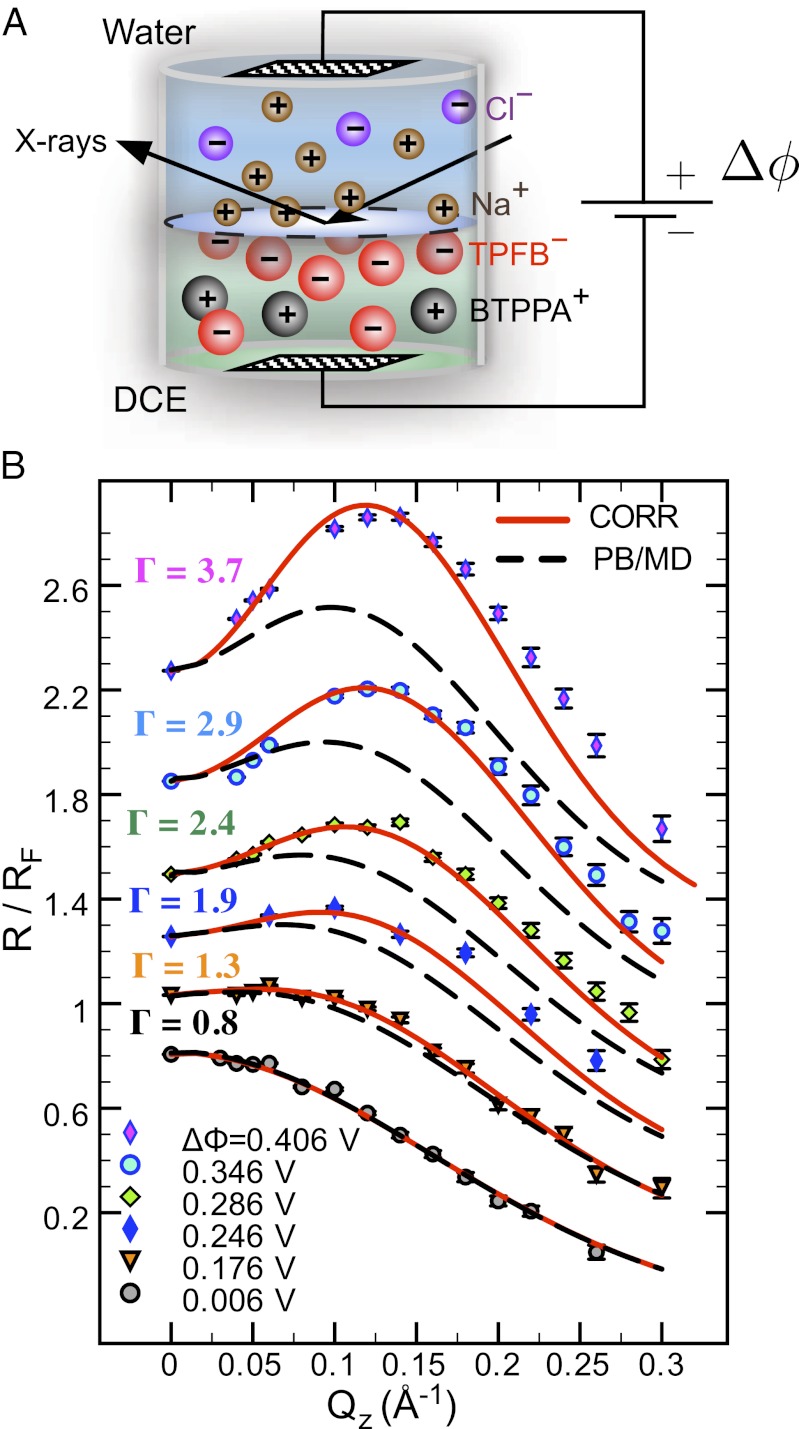
 , with ions represented by spheres. Arrows represent incident and reflected X-rays. The two grids represent the working electrodes that are ∼1 cm from the liquid/liquid interface; reference electrodes are not shown (10). Electrical double layers (not illustrated) are also formed on the working electrodes. (B) X-ray reflectivity R normalized to the Fresnel reflectivity
  from the electrified water (10 mM NaCl)/DCE (5 mM BTPPATPFB) liquid/liquid interface as a function of wave vector transfer
  (wavelength
  Å; angle of incidence α) for different electric potential differences
  (increasing from bottom to top) and TPFB− interfacial ion–ion correlation coupling strengths
  . Data are offset for clarity (without the offset,
  as
as  ). Data at
  are measurements of the beam transmitted, without reflection through the upper phase. Lines illustrate the reflectivity predicted from a model with (solid lines, CORR) and without (dashed lines, PB/MD) ion correlations.
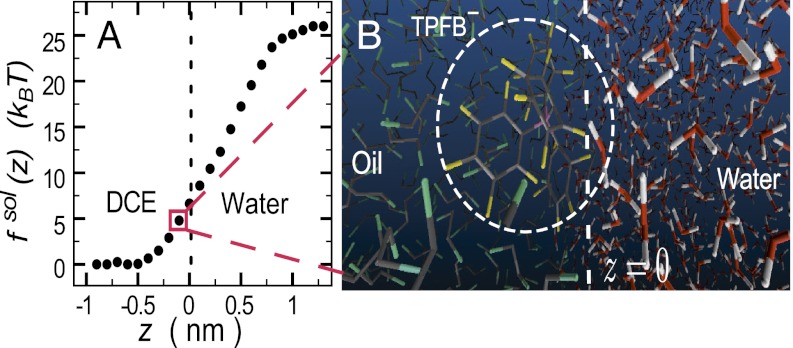
 of one TPFB− ion at the water/1,2-dichloroethane interface. Each point is calculated by an MD simulation. (B) Snapshot from the MD simulation for the interfacial depth z of the TPFB− ion (circled) shown in A.
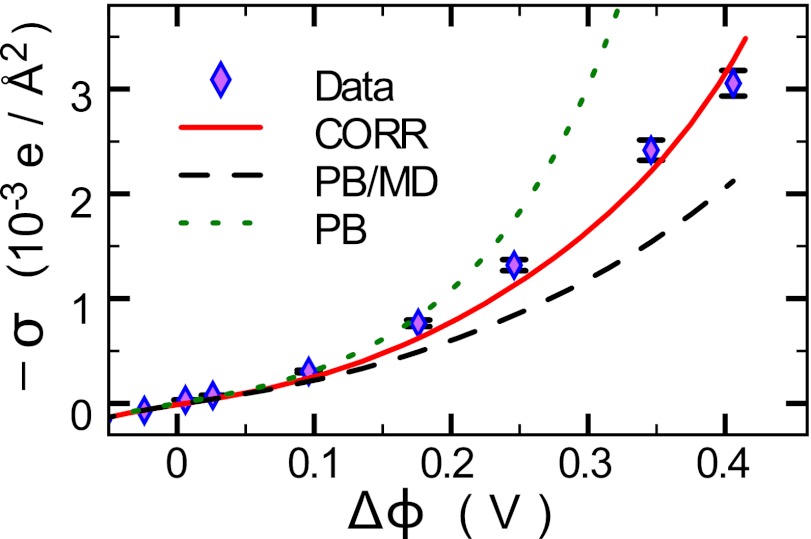
 . Lines represent predictions of the PB (electrostatics and ion entropy), PB/MD (including ion–solvent interactions), and CORR (adding correlations) models.
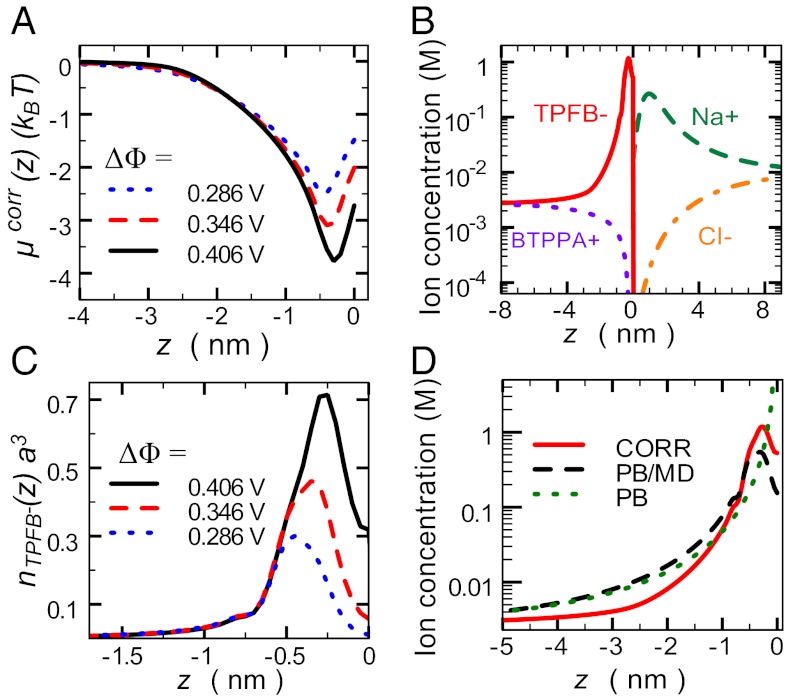
 for TPFB− for three values of
  . (B) Ion distributions at the water (
 )/DCE (
 ) interface illustrate back-to-back electrical double layers at
  in units of molarity. (C) TPFB− number density profile
  times the volume
  , where
  nm is the ion diameter, for three values of
  . (D) Comparison of the PB (Gouy–Chapman), PB/MD (PB plus ion–solvent interactions), and CORR (PB/MD plus ion–ion correlations) models for the TPFB− ion concentration (in molarity units) near the interface at
  .
.Similar articles
-
Ion distributions at the water/1,2-dichloroethane interface: potential of mean force approach to analyzing X-ray reflectivity and interfacial tension measurements.J Phys Chem B. 2013 May 2;117(17):5365-78. doi: 10.1021/jp401892y. Epub 2013 Apr 22. J Phys Chem B. 2013. PMID: 23551255
-
Electrostatic correlations in inhomogeneous charged fluids beyond loop expansion.J Chem Phys. 2012 Sep 14;137(10):104902. doi: 10.1063/1.4750044. J Chem Phys. 2012. PMID: 22979885
-
Variational approach for electrolyte solutions: from dielectric interfaces to charged nanopores.Phys Rev E Stat Nonlin Soft Matter Phys. 2010 Apr;81(4 Pt 1):041601. doi: 10.1103/PhysRevE.81.041601. Epub 2010 Apr 1. Phys Rev E Stat Nonlin Soft Matter Phys. 2010. PMID: 20481729
-
Incorporation of ion and solvent structure into mean-field modeling of the electric double layer.Adv Colloid Interface Sci. 2017 Nov;249:220-233. doi: 10.1016/j.cis.2017.05.001. Epub 2017 May 5. Adv Colloid Interface Sci. 2017. PMID: 28571611 Review.
-
Counting ions and other nucleophiles at surfaces by chemical trapping.Biophys Rev. 2017 Oct;9(5):617-631. doi: 10.1007/s12551-017-0299-x. Epub 2017 Aug 29. Biophys Rev. 2017. PMID: 28852984 Free PMC article. Review.
Cited by
-
In Situ and Operando X-ray Scattering Methods in Electrochemistry and Electrocatalysis.Chem Rev. 2024 Feb 14;124(3):629-721. doi: 10.1021/acs.chemrev.3c00331. Epub 2024 Jan 22. Chem Rev. 2024. PMID: 38253355 Free PMC article. Review.
-
Minimal effect of lipid charge on membrane miscibility phase behavior in three ternary systems.Biophys J. 2013 Jun 18;104(12):2629-38. doi: 10.1016/j.bpj.2013.04.055. Biophys J. 2013. PMID: 23790371 Free PMC article.
-
Multivalent ions and biomolecules: Attempting a comprehensive perspective.Chemphyschem. 2020 Aug 18;21(16):1742-1767. doi: 10.1002/cphc.202000162. Epub 2020 Jul 20. Chemphyschem. 2020. PMID: 32406605 Free PMC article. Review.
-
Visualizing monolayers with a water-soluble fluorophore to quantify adsorption, desorption, and the double layer.Proc Natl Acad Sci U S A. 2015 Feb 24;112(8):E826-35. doi: 10.1073/pnas.1419033112. Epub 2015 Feb 9. Proc Natl Acad Sci U S A. 2015. PMID: 25675499 Free PMC article.
-
Control of Selective Ion Transfer across Liquid-Liquid Interfaces: A Rectifying Heterojunction Based on Immiscible Electrolytes.ACS Cent Sci. 2016 Nov 23;2(11):857-866. doi: 10.1021/acscentsci.6b00266. Epub 2016 Nov 2. ACS Cent Sci. 2016. PMID: 27924315 Free PMC article.
References
-
- Gouy G. Constitution of the electric charge at the surface of an electrolyte. Journal de Physique. 1910;9:457–467.
-
- Chapman DL. A contribution to the theory of electrocapillarity. Philos Mag Ser 6. 1913;25:475.
-
- Zhang Y, Cremer PS. Interactions between macromolecules and ions: The Hofmeister series. Curr Opin Chem Biol. 2006;10(6):658–663. - PubMed
-
- Bloomfield VA. DNA condensation. Curr Opin Struct Biol. 1996;6(3):334–341. - PubMed
-
- Zhang F, et al. Reentrant condensation of proteins in solution induced by multivalent counterions. Phys Rev Lett. 2008;101(14):148101. - PubMed
Publication types
LinkOut - more resources
Full Text Sources
