. 2012 Nov 21;32(47):16541-51.
doi: 10.1523/JNEUROSCI.3047-12.2012.

Levodopa-induced dyskinesia is strongly associated with resonant cortical oscillations

Affiliations

Levodopa-induced dyskinesia is strongly associated with resonant cortical oscillations

Pär Halje et al. J Neurosci. .

Abstract

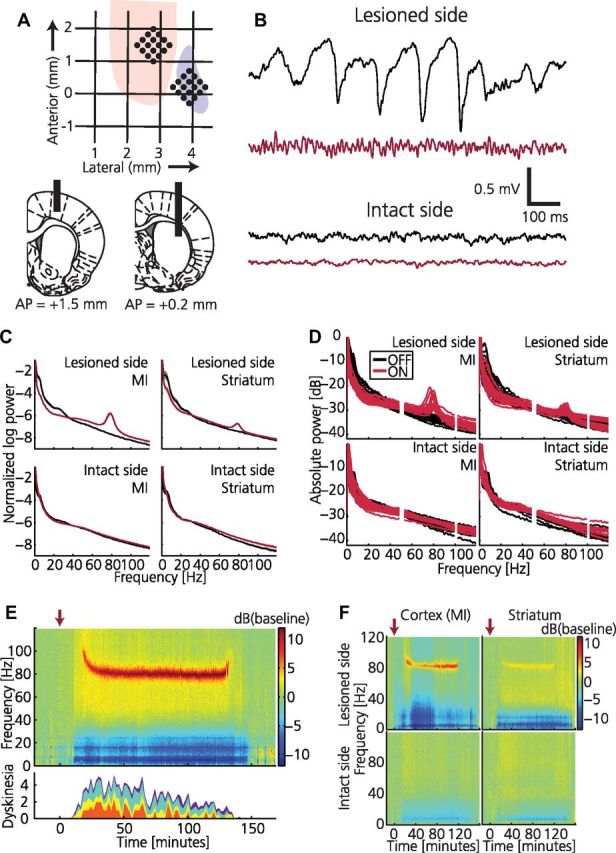
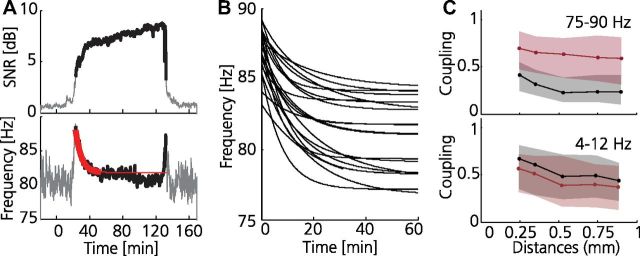
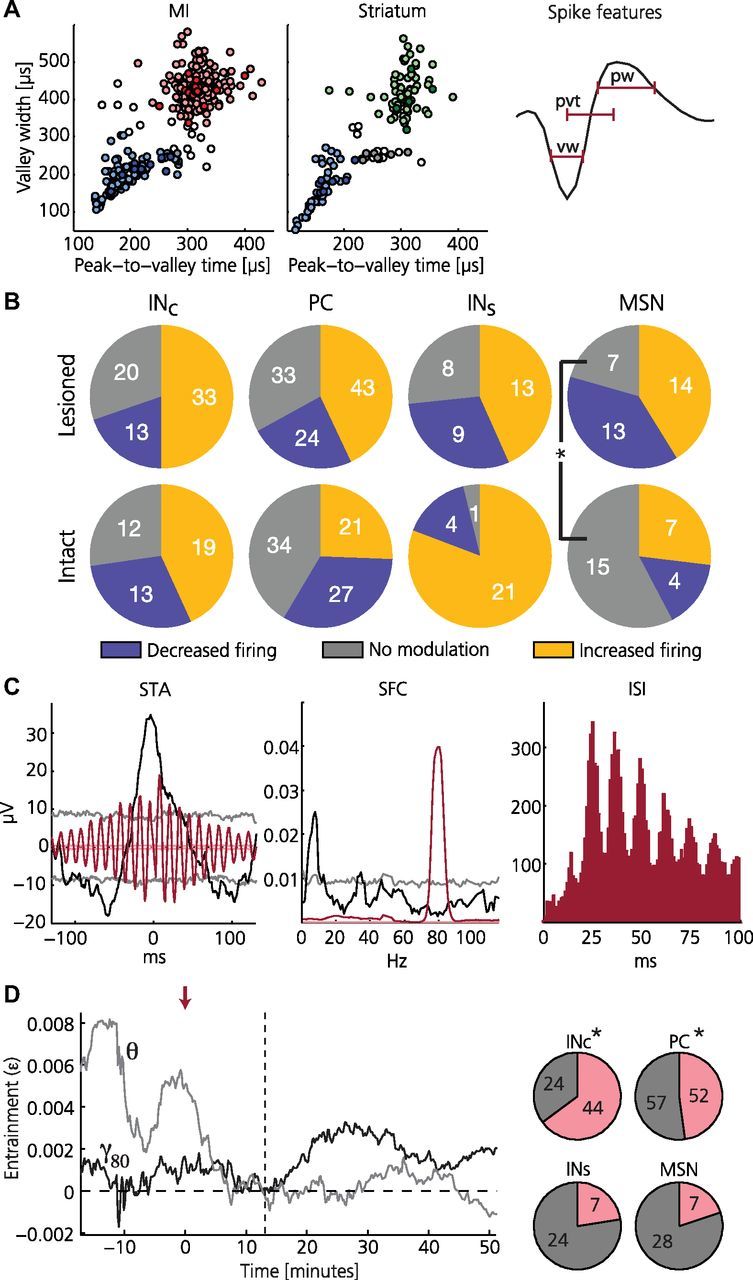
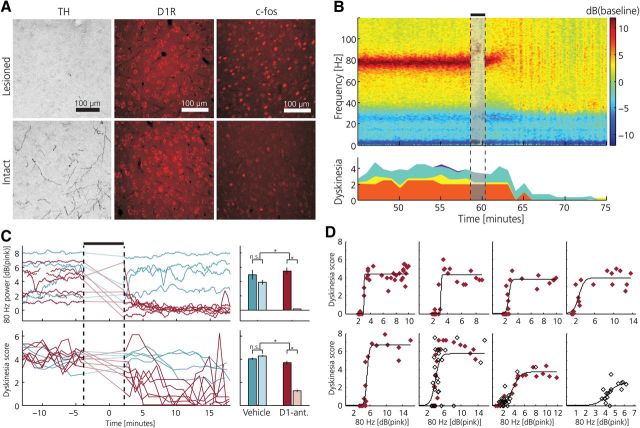
The standard pharmacological treatment for Parkinson's disease using the dopamine precursor levodopa is unfortunately limited by gradual development of disabling involuntary movements for which the underlying causes are poorly understood. Here we show that levodopa-induced dyskinesia in hemiparkinsonian rats is strongly associated with pronounced 80 Hz local field potential oscillations in the primary motor cortex following levodopa treatment. When this oscillation is interrupted by application of a dopamine antagonist onto the cortical surface the dyskinetic symptoms disappear. The finding that abnormal cortical oscillations are a key pathophysiological mechanism calls for a revision of the prevailing hypothesis that links levodopa-induced dyskinesia to an altered sensitivity to dopamine only in the striatum. Apart from having important implications for the treatment of Parkinson's disease, the discovered pathophysiological mechanism may also play a role in several other psychiatric and neurological conditions involving cortical dysfunction.


Figures

Figure 1.
Figure 1.
Dyskinesia is associated with high-frequency oscillations in cortical local field potential. A, Schematics illustrating positioning of recording electrodes relative to bregma. Top, Horizontal plane indicating anterior and lateral positions within forelimb representation in MI (pink) and striatum (purple). Bottom, Coronal plane indicating vertical positions for cortex (left) and striatum (right) together with AP positions. Electrodes were implanted bilaterally. B, Example traces of cortical LFPs recorded synchronously from the intact and lesioned hemisphere before (black) and after (red) levodopa administration. C, Average of normalized LFP power spectra for the intact and lesioned hemisphere before (black) and after (red) levodopa administration (n = 18). D, Normalized LFP power spectra shown for each experiment (50 and 100 Hz frequencies removed due to power line noise). E, Top, Spectrogram from LFP recording in lesioned MI showing a narrowband 80 Hz oscillation associated with the dyskinetic state (power spectrum normalized to pre-levodopa baseline; red arrow, levodopa injection). Bottom, Dyskinesia score (red, rotations; yellow, limbic; turquoise, axial; purple, orolingual). F, Example of spectrograms from parallel LFP recordings in all four structures.
Figure 2.
Figure 2.
Cortical oscillations associated with dyskinesia are tuned to 80 Hz. A, Example of power trend analyses of resonant oscillations during dyskinesia. Top, Signal-to-(pink)noise ratio (SNR) in the γ80 band following levodopa injection at 0 min (SNR >3 dB shown in bold). Bottom, Peak oscillation frequency as a function of time (red, exponential function fitted to the 30 min following oscillation onset, defined as SNR >3 dB; fitting period indicated in bold; goodness-of-fit, 0.02 Hz2). B, Exponential functions fitted to 20 different recordings, aligned to oscillation onset (goodness-of-fit, 0.03 ± 0.01 Hz2); note the very similar time-frequency relation in all experiments. C, Coupling strength between LFP signals recorded from different electrodes in the motor cortex of the lesioned hemisphere as estimated from measures of coherence in two different frequency bands, plotted as a function of electrode separation (OFF and ON levodopa in black and red, respectively). Note the significantly increased LFP coupling strength in the 80 Hz band (γ80, left) in the dyskinetic state (rOFF = −0.21, rON = −0.11, p ≪ 0.001, two-sample Kolmogorov–Smirnov goodness-of-fit hypothesis test). Right, The θ band (4–12 Hz) included as a reference; in contrast to the γ80, θ coupling was stronger in the non-dyskinetic state (rOFF = −0.14, rON = −0.18, p < 0.001). Calculations were performed for a 5 min period during baseline and dyskinesia, respectively. The median (solid line) and the 25th and 75th percentile (shaded area) are shown for all recordings (n = 18).
Figure 3.
Figure 3.
Individual neurons in the lesioned hemisphere show entrainment to resonant LFP oscillations. A, Classification into putative cell types for MI (left) and striatum (middle) based on spike shape features (right). For MI: red, pyramidal cells (PC); blue, interneurons (INc); uncolored, unclassified. For striatum: green, medium spiny neurons (MSN), blue, interneurons (INs); uncolored, unclassified. Darker colors mark significant entrainment to the 80 Hz band (γ80; 75–90 Hz) after levodopa administration. B, Summary of firing rate modulations: fraction of cells displaying consistent increase or decrease in firing rates during the dyskinetic state compared with pre-levodopa administration is shown for the respective cell classes. Note that only putative medium spiny neurons show a significant difference between the lesioned and the intact side (more cells are modulated on the lesioned side; two-proportion z-test, p = 0.037, Bonferroni corrected for 12 tests). C, Example of a putative pyramidal cell in lesioned MI showing strong γ80 entrainment and rhythmic firing after levodopa administration (note also pre-levodopa θ entrainment). Left: STA of LFP before (black) and after (red) levodopa administration (faded lines denote 95% confidence intervals). Middle, SFC before (black) and after (red) levodopa administration (peak values at 8 Hz and 79.5 Hz, respectively; faded lines denote 95% confidence intervals). Right: interspike interval (ISI) histogram revealing pronounced rhythmic firing at intervals of multiples of the 80 Hz period during dyskinesia. D, A majority of the cells in lesioned MI shifted from predominant θ to predominant γ80 entrainment following levodopa administration. Left, Representative example of a putative interneuron showing a shift in preferred entrainment frequency. Index of entrainment (ε) is shown for θ (gray) and γ80 (black) with ε = 0 corresponding to no entrainment (red arrow: levodopa injection; vertical dashed line: dyskinesia onset). Right, Charts summarizing the fraction of cells in lesioned cortex (top) and striatum (bottom) showing a shift in preferred entrainment frequency from θ to γ80 following levodopa administration (pink). Notably, only cells in lesioned MI showed a significant bias for such a shift (asterisk denotes p < 0.05; chance level corresponds to 25%).
Figure 4.
Figure 4.
Antagonizing D1-receptor activation in the primary motor cortex of dyskinetic animals disrupts cortical resonance and alleviates dyskinesia. A, Immunohistochemical analysis of dopaminergic markers comparing intact and lesioned MI at the time of peak dyskinesia. Left, Staining of TH-positive dopaminergic axons and terminals was markedly reduced in the lesioned hemisphere. Middle, D1R density in the lesioned hemisphere was unaltered after dopaminergic afferent denervation. Right, Expression of the immediate early gene c-fos after levodopa administration was relatively increased on the lesioned side. B, Topical application of the D1R antagonist SCH23390 to the cortical surface disrupts 80 Hz cortical resonant oscillation and alleviates dyskinetic symptoms. Left, Example of spectrogram from LFP recording in MI, power spectrum normalized to pre-levodopa baseline; D1R-antagonist injection denoted by black bar and faded colors. Dyskinesia score is shown at the bottom (red, rotations; yellow, limbic; turquoise, axial; purple, orolingual). C, Summary of all experiments (n = 11) showing γ80 oscillations (top) and dyskinetic symptoms (bottom) following topical application of SCH23390 (red) or saline (blue), respectively (γ80 power expressed relative to the pink noise background). Note the parallel decline in the power of the resonant LFP oscillation and the dyskinesia score in all experiments (traces during the period of drug application are linearly interpolated). Right, Average data from all experiments showing significant differences between D1R-antagonist vs vehicle treatment before (darker colors) and after topical application. Error bars denote SEM. *p < 0.05. D, Characterization of the relationship between γ80 and severity of dyskinesia during the early dyskinetic phase (first 40 min following levodopa injection) and the cessation of dyskinesia following topical application of SCH23390. Each panel represents a single experiment (n = 5 rats) and displays the dyskinesia score as a function of cortical γ80 power (each symbol denotes average over a 1 min period: filled, early dyskinetic phase; open, cessation of dyskinesia following SCH23390). The relationships were well fitted with sigmoid functions (average goodness-of-fit, R2 = 0.72 ± 0.22). Notably, a similar relation between γ80 power and the severity of dyskinesia is evident during the early phase of dyskinesia and following pharmacological γ80 suppression.

Similar articles

Cited by

References

    1. Alonso-Frech F, Zamarbide I, Alegre M, Rodríguez-Oroz MC, Guridi J, Manrique M, Valencia M, Artieda J, Obeso JA. Slow oscillatory activity and levodopa-induced dyskinesias in Parkinson's disease. Brain. 2006;129:1748–1757. - PubMed
    1. Anderson CT, Sheets PL, Kiritani T, Shepherd GM. Sublayer-specific microcircuits of corticospinal and corticostriatal neurons in motor cortex. Nat Neurosci. 2010;13:739–744. - PMC - PubMed
    1. Aubert I, Guigoni C, Håkansson K, Li Q, Dovero S, Barthe N, Bioulac BH, Gross CE, Fisone G, Bloch B, Bezard E. Increased D1 dopamine receptor signaling in levodopa-induced dyskinesia. Ann Neurol. 2005;57:17–26. - PubMed
    1. Barthó P, Hirase H, Monconduit L, Zugaro M, Harris KD, Buzsáki G. Characterization of neocortical principal cells and interneurons by network interactions and extracellular features. J Neurophysiol. 2004;92:600–608. - PubMed
    1. Berke JD, Okatan M, Skurski J, Eichenbaum HB. Oscillatory entrainment of striatal neurons in freely moving rats. Neuron. 2004;43:883–896. - PubMed

Publication types

MeSH terms

LinkOut - more resources