. 2012 Nov 21;32(47):16602-15.
doi: 10.1523/JNEUROSCI.0554-12.2012.

Contribution of cholinergic and GABAergic mechanisms to direction tuning, discriminability, response reliability, and neuronal rate correlations in macaque middle temporal area

Affiliations

Contribution of cholinergic and GABAergic mechanisms to direction tuning, discriminability, response reliability, and neuronal rate correlations in macaque middle temporal area

Alexander Thiele et al. J Neurosci. .

Abstract

Previous studies have investigated the effects of acetylcholine (ACh) on neuronal tuning, coding, and attention in primary visual cortex, but its contribution to coding in extrastriate cortex is unexplored. Here we investigate the effects of ACh on tuning properties of macaque middle temporal area MT neurons and contrast them with effects of gabazine, a GABA(A) receptor blocker. ACh increased neuronal activity, it had no effect on tuning width, but it significantly increased the direction discriminability of a neuron. Gabazine equally increased neuronal activity, but it widened tuning curves and decreased the direction discriminability of a neuron. Although gabazine significantly reduced response reliability, ACh application had little effect on response reliability. Finally, gabazine increased noise correlation of simultaneously recorded neurons, whereas ACh reduced it. Thus, both drugs increased firing rates, but only ACh application improved neuronal tuning and coding in line with effects seen in studies in which attention was selectively manipulated.


Figures
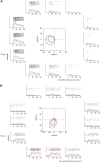
Figure 1.
Figure 1.
Effects of gabazine and ACh on direction tuning in two example neurons. A, Stimulus-driven activity when gabazine was applied and when it was not applied. B, Stimulus-driven activity, when ACh was applied and when it was not applied. Blue rasters, histograms, and tuning curves in A and B show data when no drug was applied. Red rasters, histograms, and tuning curves show data when the drug was applied. Two sets of blue rasters are shown in each histogram (flanking the red rasters). The bottom set of rasters corresponds to the initial recording, whereas the top set corresponds to the activity associated with the recovery recording. The dashed ellipsoid in the center corresponds to the wrapped Gaussian fitting, i.e., they are the tuning curves from which tuning width and amplitude were extracted.
Figure 2.
Figure 2.
Effect of gabazine and ACh on spontaneous activity. A, Mean spontaneous activity when gabazine was not applied (plotted along the x-axis) and when gabazine was applied (plotted along the y-axis). B, Mean spontaneous activity when ACh was not applied (plotted along the x-axis) and when ACh was applied (plotted along the y-axis). p values denote significance of drug effects (Wilcoxon's signed-rank test). Black squares indicate whether spontaneous activity was significantly affected by the drug, and gray circles indicate that spontaneous activity was not significantly affected.
Figure 3.
Figure 3.
Effects of gabazine and ACh on activity (in spikes per second). A, PD activity (PD act) when gabazine was not applied (plotted along the x-axis) and when gabazine was applied (plotted along the y-axis). B, PD activity (PD act) when ACh was not applied (plotted along the x-axis) and when ACh was applied (plotted along the y-axis). p values denote significance of drug effects (Wilcoxon's signed-rank test). The time window analyzed (relative to neuronal response onset) is indicated above each column. Data obtained at 25% contrast are shown in columns 1 and 2. Data obtained at 12.5% contrast are shown in columns 3 and 4. Square symbols indicate that stimulus-driven activity was significantly affected by the drug: black squares indicate that PD activity was also significantly affected by the drug, and gray circles indicate that stimulus-driven activity was not significantly affected (but spontaneous activity was).
Figure 4.
Figure 4.
Effects of ejection current and drug type on stimulus-driven activity. A, B, Drug-induced change in activity (drug MI), plotted against the ejection current used for the two drugs, with different contrast and analysis windows. p values show that drug MI was not significantly correlated with ejection current. C–F, Drug-induced activity changes (drug MI) for the two drugs, at different contrasts and time windows (gray histogram, gabazine drug MI; black histogram, ACh drug MI). p values indicate whether the two distributions significantly differed. G, Example of contrast-induced activity changes when no drug was applied (black histogram) and contrast-induced activity changes when ACh was applied (gray histogram). Time window used was 0–150 ms after neuronal response onset. PD act, PD activity.
Figure 5.
Figure 5.
Influence of gabazine and ACh on DIs. A, Time-resolved DIs when gabazine was not applied (black solid line) and when it was applied (black dashed line). B, DI values measured within the two response windows and two contrasts when gabazine was applied and when it was not applied. C, Time-resolved DIs when ACh was not applied (black solid line) and when it was applied (black dashed line). D, DI values measured within the two response windows and two contrasts when ACh was applied and when it was not applied. Left column shows data for 25% stimulus contrast, and right column shows data for 12.5% stimulus contrast. The small box underneath each time-resolved DI plot shows the p value [log(1/p)] for each time bin (10 ms width) comparing the DI distribution of drug applied versus not applied (signed-rank test). To account for multiple comparisons, we used FDR correction (see Materials and Methods). The dashed line in each p value plot gives the FDR-corrected significance level of 0.05. Values above this line are significant. p values in B and D indicated whether drug application significantly changed DIs.
Figure 6.
Figure 6.
Influence of gabazine and ACh on tuning width and tuning amplitude. The top two rows show data relating to gabazine application (row 1, tuning width; row 2, tuning amplitude), and the bottom two rows show data relating to ACh application (row 3, tuning width; row 4, tuning amplitude). Columns 1 (25% contrast stimuli) and 2 (12.5% contrast stimuli) show data relating to the early response window, and columns 3 (25% contrast stimuli) and 4 (12.5% contrast stimuli) show data relating to the late response window. Data obtained in the no-drug condition are plotted along the x-axis in each subplot, and those obtained with drug applied are plotted along the y-axis in each subplot. p values indicate level of significance for the drug/no-drug comparison (signed-rank test).
Figure 7.
Figure 7.
Influence of gabazine and ACh on neuronal discriminability. The top row shows the results when gabazine was not applied (black) and when it was applied (gray) for 25% contrast stimuli (solid lines) and 12.5% contrast stimuli (dashed lines). The bottom row shows the equivalent results for ACh. The left column shows the data for the early response window, and the right column shows the data for the late response window. x-Axis shows angular difference of stimuli used for d′ calculation. The reference was the preferred motion stimulus. Error bars show SEM. p values denote level of significance of factors drug, direction, contrast, and interaction (if significant) based on three-factor RM-ANOVA.
Figure 8.
Figure 8.
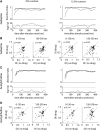
Influence of gabazine and ACh on response reliability. Response reliability (FF) was measured in windows of 50 ms length, shifted in steps of 50 ms after response onset (x-axis). The top row shows the results when gabazine was not applied and when it was applied for stimuli moving in PD (black lines) and APD (gray lines). The bottom row shows the equivalent results for ACh. The left column shows the data for 25% contrast stimuli, and the right column shows the data for 12.5% contrast stimuli. Solid lines show data for the no drug condition, and dashed lines show data for the drug condition. Error bars show SEM. The black straight horizontal lines show spontaneous FF and SEM (solid line, drug not applied; dotted line, drug applied).
Figure 9.
Figure 9.
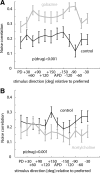
Influence of gabazine (A) and ACh (B) on noise correlations for stimuli moving in different directions relative to PD. Gray lines and error bars show the noise correlations when the drug was applied, and black lines and error bars show the noise correlations when no drug was applied. Noise correlation data for the different contrasts are pooled, because there was no difference between 25 and 12.5% contrast stimuli. p values denote whether drug application had a significant effect on noise correlations. Error bars show SEM.

Similar articles

Cited by

References

    1. Albright TD. Direction and orientation selectivity of neurons in visual area MT of the macaque. J Neurophysiol. 1984;52:1106–1130. - PubMed
    1. Anthony BL, Dennison RL, Aronstam RS. Disruption of muscarinic receptor-G protein coupling is a general property of liquid volatile anesthetics. Neurosci Lett. 1989;99:191–196. - PubMed
    1. Benjamini Y, Hochberg Y. Controlling the false discovery rate: a practical and powerful approach to multiple testing. J R Stat Soc Ser B Stat Methodol. 1995;57:289–300.
    1. Bisley JW, Zaksas D, Droll JA, Pasternak T. Activity of neurons in cortical area MT during a memory for motion task. J Neurophysiol. 2004;91:286–300. - PubMed
    1. Britten KH, Shadlen MN, Newsome WT, Movshon JA. The analysis of visual motion: a comparison of neuronal and psychophysical performance. J Neurosci. 1992;12:4745–4765. - PMC - PubMed

Publication types

MeSH terms

LinkOut - more resources