. 2012 Nov 21;32(47):16683-92.
doi: 10.1523/JNEUROSCI.4235-11.2012.

Neural correlates of anticipation risk reflect risk preferences

Affiliations

Neural correlates of anticipation risk reflect risk preferences

Sarah Rudorf et al. J Neurosci. .

Abstract

Individual risk preferences have a large influence on decisions, such as financial investments, career and health choices, or gambling. Decision making under risk has been studied both behaviorally and on a neural level. It remains unclear, however, how risk attitudes are encoded and integrated with choice. Here, we investigate how risk preferences are reflected in neural regions known to process risk. We collected functional magnetic resonance images of 56 human subjects during a gambling task (Preuschoff et al., 2006). Subjects were grouped into risk averters and risk seekers according to the risk preferences they revealed in a separate lottery task. We found that during the anticipation of high-risk gambles, risk averters show stronger responses in ventral striatum and anterior insula compared to risk seekers. In addition, risk prediction error signals in anterior insula, inferior frontal gyrus, and anterior cingulate indicate that risk averters do not dissociate properly between gambles that are more or less risky than expected. We suggest this may result in a general overestimation of prospective risk and lead to risk avoidance behavior. This is the first study to show that behavioral risk preferences are reflected in the passive evaluation of risky situations. The results have implications on public policies in the financial and health domain.


Figures

Figure 1.
Figure 1.
Distribution of CEs in the sample. The CE is the lowest safe payment a subject prefers over playing a lottery. The difference between the CE and the lottery's expected value (EV; indicated by the dashed line) is used to infer subjects' risk preferences. Columns are shaded in gray for risk averters and white for risk seekers. The diagonal line pattern indicates risk-neutral subjects who were indifferent around the EV.
Figure 2.
Figure 2.
Time line of the gambling paradigm. Participants start off with an initial endowment of €25. In 30 trials they first place a bet of €1 on whether the second card will be higher or lower than the first card. After placing the bet, they watch the first card being drawn, followed 6 s later by the second card. Finally, they are asked to indicate whether they have won or lost the gamble. With display of the first card, risk is partially resolved, and a risk prediction error occurs. The anticipation risk is maintained until display of the second card, when the gamble is resolved.
Figure 3.
Figure 3.
Anticipation risk coding. Neural activation in bilateral ventral striatum (vStr; top) and anterior insula (aIns; bottom) during anticipation of the second card that correlates with anticipation risk, i.e., expected outcome variance. The figures (left) show statistical parametric maps of the random effects analysis, color coded for the t values as indicated by the color bar (p < 0.05, FWE corrected for whole-brain volume). The graphs (right) show mean β estimates in the respective structures plotted against five anticipation risk values, averaged over all subjects and for each risk preference type individually. On average, neural responses are lowest for sure wins and losses and highest for trials with uncertain outcomes. Risk-averse and risk-neutral subjects show greater responses to higher risk values than risk-seeking subjects.
Figure 4.
Figure 4.
Interaction effect of risk preferences and anticipation risk coding in a two-by-two ANOVA. During high-risk trials, the neural response to anticipation risk is stronger in risk averters than in risk seekers (interaction effect, p < 0.05, FWE corrected for small volumes). Plots show the mean (M) and SE of the individual peak β estimates within the indicated search volume. Data from risk-averse and risk-neutral subjects were combined for these plots. The inset (right) illustrates subjective risk estimates based on a simple reinforcement learning model using asymmetric risk prediction errors. This model predicts the interaction effect that we observe for anticipation risk and risk preferences. vStr, Ventral striatum; aIns, anterior insula.
Figure 5.
Figure 5.
Risk prediction error coding. Neural activation in bilateral anterior insula (aIns; top), ACC, and vStr (bottom) correlate positively with deviations from previous risk predictions, i.e., risk prediction error. The figures (left) show statistical parametric maps of the random effects analysis, color coded for the t values as indicated by the color bar (p < 0.05, FWE corrected for whole-brain volume). The graphs (right) show mean β estimates in the respective structures plotted against five risk prediction error values, averaged over all subjects and for each risk preference type individually. On average, neural responses increase linearly with risk prediction error. Risk-averse subjects respond more strongly than risk-seeking subjects to any risk prediction error.
Figure 6.
Figure 6.
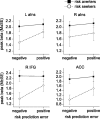
Interaction effect of risk preferences and risk prediction error coding in a two-by-two ANOVA. Risk averters show an elevated but equally strong BOLD signal to both positive and negative risk prediction errors. Risk seekers respond significantly less to gambles that are not as risky as expected, reflected by negative risk prediction errors (interaction effect, p < 0.05, FWE corrected for small volumes; ACC, p < 0.05, FWE corrected for whole-brain volume). Plots show the mean (M) and SE of the individual peak β estimates within the indicated search volume. Data from risk-averse and risk-neutral subjects were combined for these plots. aIns, Anterior insula; L, left; R, right.

References

    1. Bechara A, Damasio AR, Damasio H, Anderson SW. Insensitivity to future consequences following damage to human prefrontal cortex. Cognition. 1994;50:7–15. - PubMed
    1. Bechara A, Damasio H, Tranel D, Damasio AR. Deciding advantageously before knowing the advantageous strategy. Science. 1997;275:1293–1295. - PubMed
    1. Blais AR, Weber EU. A domain-specific risk-taking (DOSPERT) scale for adult populations. Judgment Decision Making. 2006;1:33–47.
    1. Bossaerts P. Risk and risk prediction error signals in anterior insula. Brain Struct Funct. 2010;214:645–653. - PubMed
    1. Christopoulos GI, Tobler PN, Bossaerts P, Dolan RJ, Schultz W. Neural correlates of value, risk, and risk aversion contributing to decision making under risk. J Neurosci. 2009;29:12574–12583. - PMC - PubMed

Publication types