. 2012 Nov 21;32(47):16763-74.
doi: 10.1523/JNEUROSCI.1885-12.2012.

The lateral hypothalamic area controls paradoxical (REM) sleep by means of descending projections to brainstem GABAergic neurons

Affiliations

The lateral hypothalamic area controls paradoxical (REM) sleep by means of descending projections to brainstem GABAergic neurons

Olivier Clément et al. J Neurosci. .

Abstract

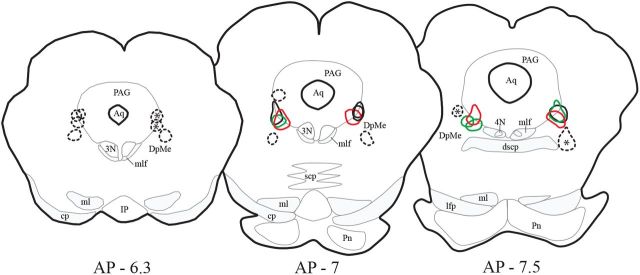
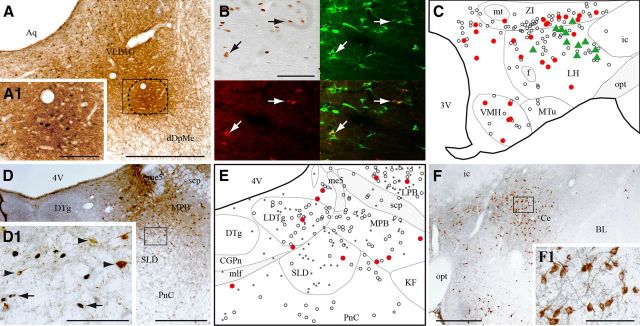
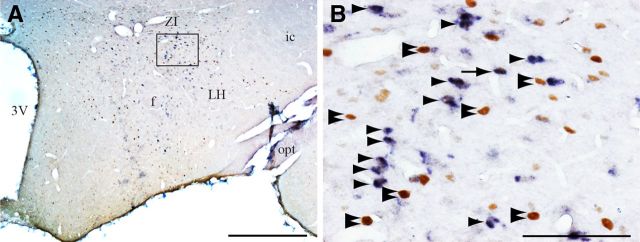
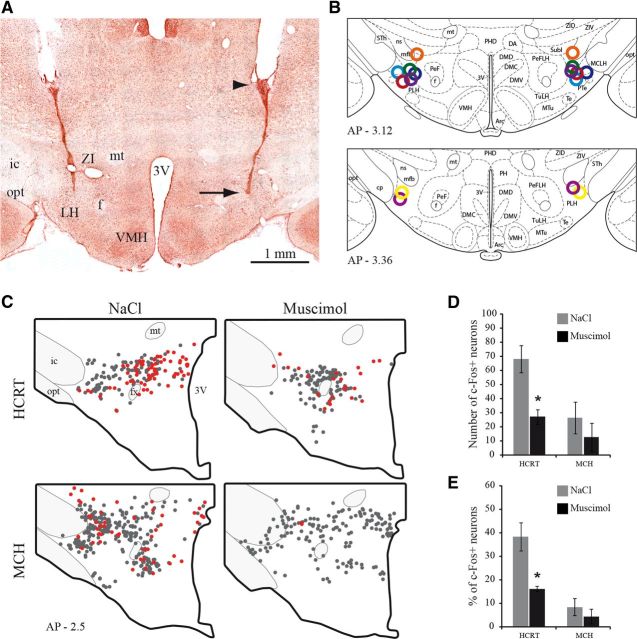
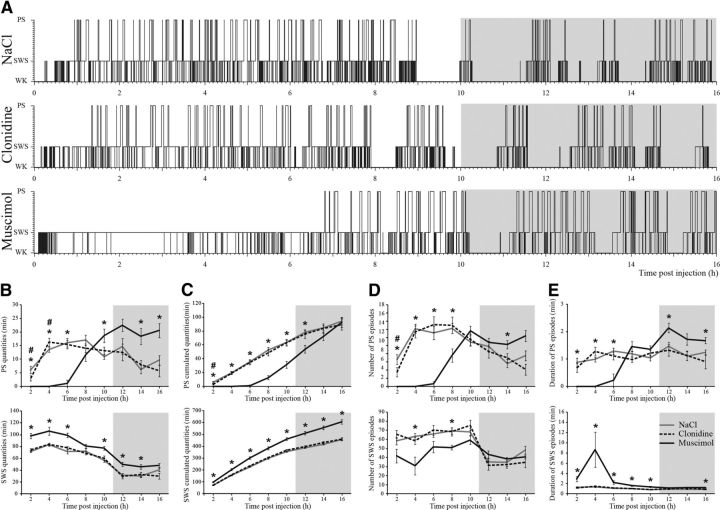
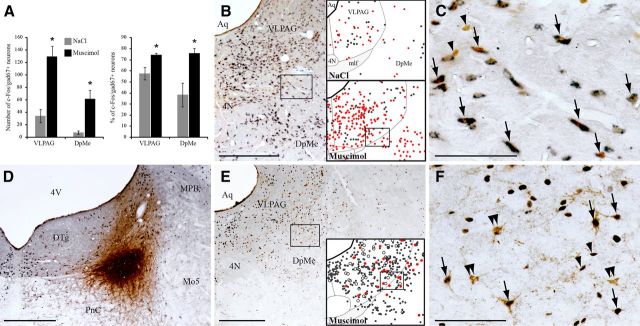
It has recently been shown that the ventrolateral part of the periaqueductal gray (VLPAG) and the adjacent dorsal deep mesencephalic nucleus (dDpMe) contain GABAergic neurons gating paradoxical sleep (PS) onset by means of their projection to the glutamatergic PS-on neurons of the sublaterodorsal tegmental nucleus (SLD). To determine the mechanisms responsible for the cessation of activity of these GABAergic PS-off neurons at the onset and during PS, we combined the immunostaining of c-FOS, a marker of neuronal activation, with cholera toxin b subunit (CTb) retrograde tracing from the VLPAG/dDpMe in three groups of rats (control, PS deprived, and PS hypersomniac). We found that the lateral hypothalamic area (LH) is the only brain structure containing a very large number of neurons activated during PS hypersomnia and projecting to the VLPAG/dDpMe. We further demonstrated that 44% of these neurons express the neuropeptide melanin concentrating hormone (MCH). We then showed that bilateral injections in the LH of two inhibitory compounds, clonidine (an α-2 adrenergic agonist) and muscimol (a GABAa agonist) induce an inhibition of PS. Furthermore, after muscimol injections in the LH, the VLPAG/dDpMe contained a large number of activated neurons, mostly GABAergic, and projecting to the SLD. Altogether, our results indicate for the first time that the activation of a population of LH neurons, in part MCH containing, is necessary for PS to occur. Furthermore, our results strongly suggest that these neurons trigger PS by means of their inhibitory projection to the PS-off GABAergic neurons located in the VLPAG/dDpMe.


Figures

Figure 1.
Figure 1.
Localization of the CTb injection sites. The cores of the 12 CTb injection sites located in the VLPAG/dDpMe are delineated by red, green, and black lines for PS hypersomniac, PS deprived, and control animals, respectively. The cores of the injection sites were defined by a dense full labeling of the tissue in contrast to the halo surrounding them in which CTb labeling was observed in fibers and cell bodies. These animals were used for the analysis of CTb/c-Fos double-labeling across the entire brain. Black dashed lines delineate the 12 CTb control injections sites localized in the structures surrounding the VLPAG/dDpMe. The sites labeled with an asterisk correspond to the four control injections obtained in PS hypersomniac animals and for which CTb+ and CTb/c-FOS+ neurons were counted in the entire brain.
Figure 2.
Figure 2.
VLPAG/dDpMe afferents expressing c-FOS during PS-hypersomnia. A, Illustration of a CTb injection site located at the border of the VLPAG and dDpMe in a PS-deprived rat. The enlargement in A1 shows the numerous c-FOS+ neurons within the core of the injection site (delineated by a line) indicating that the neurons specifically active during PS deprivation were effectively targeted. B, Composite photomicrograph illustrating a triple labeling for c-FOS (DAB staining, top left), CTb (in red, bottom left), and MCH (in green, top left) in a PSR animal. An overlay photomicrograph is shown at the bottom right. Arrows point out triple labeled neurons. C, Schematic distribution of CTb/c-FOS/MCH+ (green triangles), CTb/c-FOS+ (red dots), and singly CTb+ (open circles) neurons within the tuberal hypothalamus (AP, −2.6 mm) in a PSR animal. D, Photomicrograph showing that the SLD contains only singly CTb+ (brown cytoplasm) and singly c-FOS+ (black nuclear staining) neurons in PSR animals. The box in D is enlarged in D1. Arrows and arrowheads point to c-FOS+ and CTb+ singly labeled neurons, respectively. E, Schematic illustration of singly CTb+ (open circles), singly c-FOS+ (black dots), and CTb/c-FOS+ (red dots) neurons in the SLD and surrounding structures (AP, −9.2 mm) in a PSR animal. F, Photomicrograph showing in a PSR animal the large number of singly CTb+ cells (brown cytoplasmic labeling) in the Ce after a CTb injection in the VLPAG/dDpMe. The square area is enlarged in F1. Scale bars: A, D, F, 500 μm; A1, D1, F1, 100 μm; B, 200 μm. 3V, Third ventricle; 4N, trochlear nucleus; 4V, fourth ventricle; Aq, aqueduct; BL, basolateral amygdaloid nucleus; CGPn, central gray of the pons; f, fornix; ic, internal capsule; me5, mesencephalic trigeminal tract; mlf, medial longitudinal fasciculus; MPB, medial parabrachial nucleus; mt, mammillothalamic tract; MTu, medial tuberal nucleus; opt, optic tract; VMH, ventromedial hypothalamic nucleus.
Figure 3.
Figure 3.
Neurotensin expressing neurons in the LH are not c-FOS+ during PS hypersomnia. A, Low-power photomicrograph of a double-stained section for neurotensin (dark blue diffuse cytoplasmic staining) and c-FOS (DAB brown nuclear staining) in a coronal section passing through the LH in a PSR animal. B, Enlargement of the framed area in A. Arrow point out c-FOS/ neurotensin+, arrowheads neurotensin+, and double arrowheads singly c-FOS+ neurons. Scale bars: A, 500 μm; B, 100 μm. 3V, Third ventricle; f, fornix; ic, internal capsule; opt, optic tract.
Figure 4.
Figure 4.
Localization of injection sites in the LH. A, Photomicrograph of a bilateral injection site within the LH as visualized on a neutral red counterstained section. A black arrow points out the extremity of the cannula and an arrowhead the tip of the guide cannula. B, All injection sites are illustrated by open circles with different colors on two atlas sections. Adapted from Paxinos (1997) and Watson Rat Brain atlas, fifth edition. C, Schematic drawings of sections illustrating in representative animals singly HCRT+, or MCH+, (gray dots), and c-FOS/HCRT+, or c-FOS/MCH+ (red dots) neurons in animals perfused 3 h after NaCl or muscimol injection in the LH. The rostrocaudal level of the section is indicated in the bottom left corner (in mm from bregma). D, Numbers (mean ± SEM) of HCRT and MCH immunoreactive neurons expressing c-FOS in rats perfused 3 h after muscimol or NaCl treatments (n = 4 rats per group). E, Percentages of HCRT and MCH immunoreactive neurons expressing c-FOS in animals perfused 3 h after muscimol and NaCl treatments (n = 4 per group). *p < 0.05 vs NaCl condition. 3V, Third ventricle; f, fornix; ic, internal capsule; mt, mammillothalamic tract; opt, optic tract; VMH, ventromedial hypothalamic nucleus.
Figure 5.
Figure 5.
Pharmacological inactivation of LH neurons inhibits PS. A, Hypnograms illustrating the organization of the sleep-waking cycle during the 16 h (between 10:00 A.M. and 2:00 A.M.) following an injection of NaCl, clonidine, or muscimol in the LH in a representative animal. A gray background differentiates the dark period. B–E, Quantitative analysis of sleep by 2 h blocks during the 16 h after muscimol (black lines), clonidine (black dashed lines), and NaCl (gray lines) application in LH. The quantities per 2 h blocks (B), the cumulated quantities across the 16 h (C), the number of episodes (D), and the mean duration of episodes (E) are given for PS and SWS. For all graphs, n = 8 animals per group, values are mean ± SEM and *p < 0.05 between muscimol and NaCl, #p < 0.05 between clonidine and NaCl.
Figure 6.
Figure 6.
Muscimol inhibition of LH induces an activation of VLPAG/dDpMe GABAergic neurons projecting to the SLD. A–F, Neurons visualized 3 h after muscimol or NaCl injection in the LH. A, Histograms showing the number and percentage (over the total number of c-FOS+ neurons) of c-FOS/gad67+ neurons in the VLPAG and dDpMe in animals after injections of NaCl or muscimol in the LH (n = 4 per group). Values are mean ± SEM and *p < 0.05 vs NaCl. B, Low-power photomicrograph (left) of a double stained section for gad67 (dark blue diffuse cytoplasmic staining) and c-FOS (DAB brown nuclear staining) in an animal that received a muscimol injection in the LH. The same section is shown as a drawing in the lower right corner with singly c-FOS+ neurons illustrated by gray dots and double-labeled c-FOS/gad67+ neurons by red dots. The number of double-labeled neurons is much higher after muscimol than after NaCl (top right). The framed area in the photomicrograph and the drawing is enlarged in C. Arrows point out c-FOS/gad67 double-labeled neurons and arrowheads c-FOS singly labeled neurons. D, Low-power photomicrograph showing the localization of a CTb injection site within the SLD. E, Low-power photomicrograph of a section double-stained with CTb and c-FOS and its schematic drawing illustrating CTb+ (brown cytoplasmic labeling, open circles), c-FOS+ (black nuclear staining, gray dots), and CTb/c-FOS+ (red dots) neurons in the VLPAG/dDpMe in an animal with a CTb injection in the SLD perfused 3 h after muscimol application in the LH. The framed area in E is enlarged in F. Arrows point out CTb/c-FOS+, arrowheads singly c-FOS+, and double arrowheads singly CTb+ labeled neurons. The same animal is represented in D–F. Scale bars: B, D, E, 500 μm; C, F, 100 μm. 4N, Trochlear nucleus; 4V, fourth ventricle; Aq, aqueduct; mlf, medial longitudinal fasciculus; Mo5, motor trigeminal nucleus; MPB, medial parabrachial nucleus.

References

    1. Adamantidis AR, Zhang F, Aravanis AM, Deisseroth K, de Lecea L. Neural substrates of awakening probed with optogenetic control of hypocretin neurons. Nature. 2007;450:420–424. - PMC - PubMed
    1. Bayer L, Eggermann E, Serafin M, Grivel J, Machard D, Muhlethaler M, Jones BE. Opposite effects of noradrenaline and acetylcholine upon hypocretin/orexin versus melanin concentrating hormone neurons in rat hypothalamic slices. Neuroscience. 2005;130:807–811. - PubMed
    1. Behbehani MM. Functional characteristics of the midbrain periaqueductal gray. Prog Neurobiol. 1995;46:575–605. - PubMed
    1. Bittencourt JC, Presse F, Arias C, Peto C, Vaughan J, Nahon JL, Vale W, Sawchenko PE. The melanin-concentrating hormone system of the rat brain: an immuno- and hybridization histochemical characterization. J Comp Neurol. 1992;319:218–245. - PubMed
    1. Boissard R, Gervasoni D, Schmidt MH, Barbagli B, Fort P, Luppi PH. The rat ponto-medullary network responsible for paradoxical sleep onset and maintenance: a combined microinjection and functional neuroanatomical study. Eur J Neurosci. 2002;16:1959–1973. - PubMed

Publication types

MeSH terms

LinkOut - more resources