

Weighted pedigree-based statistics for testing the association of rare variants
- PMID: 23176082
- PMCID: PMC3827928
- DOI: 10.1186/1471-2164-13-667
Weighted pedigree-based statistics for testing the association of rare variants
Abstract
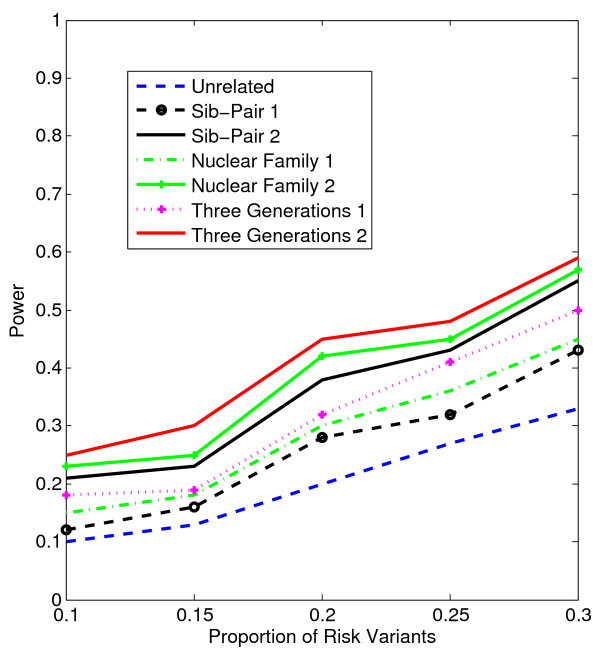
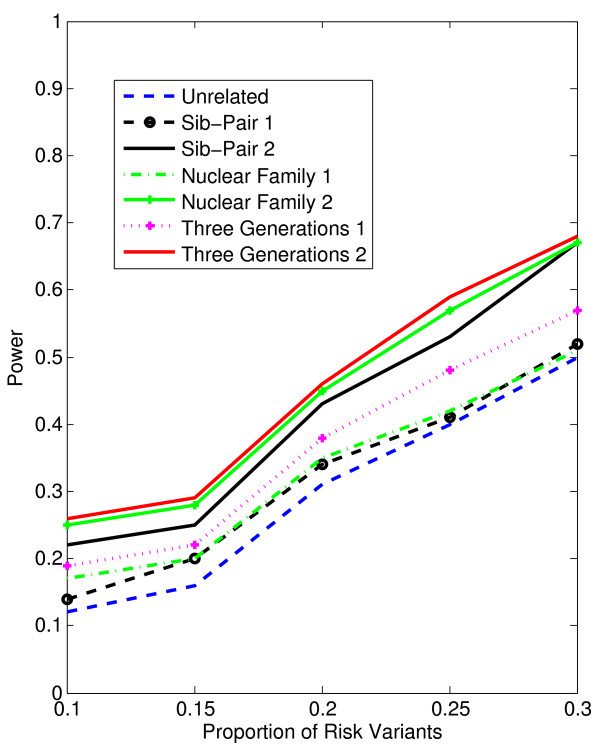
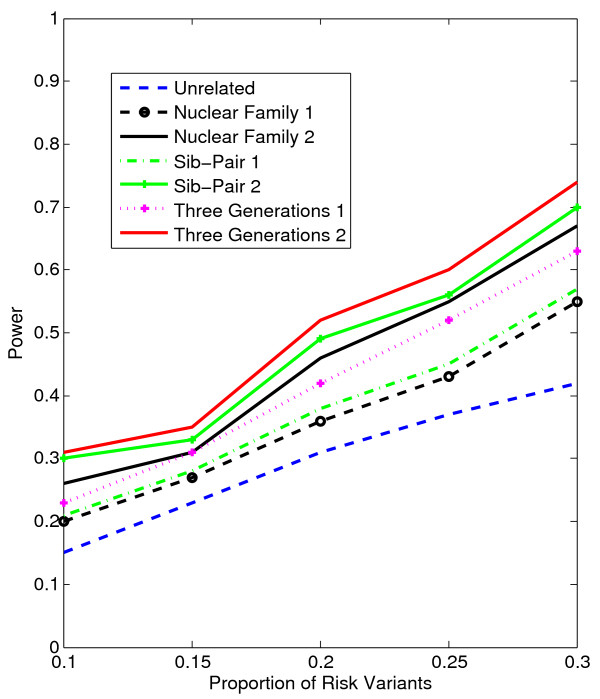
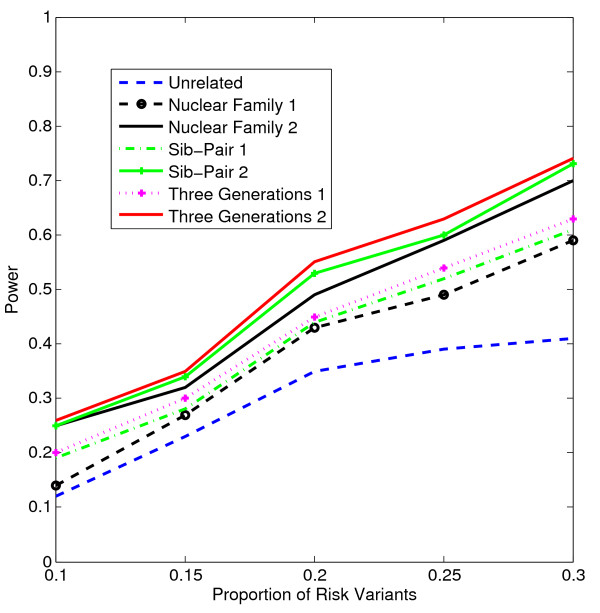
Background: With the advent of next-generation sequencing (NGS) technologies, researchers are now generating a deluge of data on high dimensional genomic variations, whose analysis is likely to reveal rare variants involved in the complex etiology of disease. Standing in the way of such discoveries, however, is the fact that statistics for rare variants are currently designed for use with population-based data. In this paper, we introduce a pedigree-based statistic specifically designed to test for rare variants in family-based data. The additional power of pedigree-based statistics stems from the fact that while rare variants related to diseases or traits of interest occur only infrequently in populations, in families with multiple affected individuals, such variants are enriched. Note that while the proposed statistic can be applied with and without statistical weighting, our simulations show that its power increases when weighting (WSS and VT) are applied.
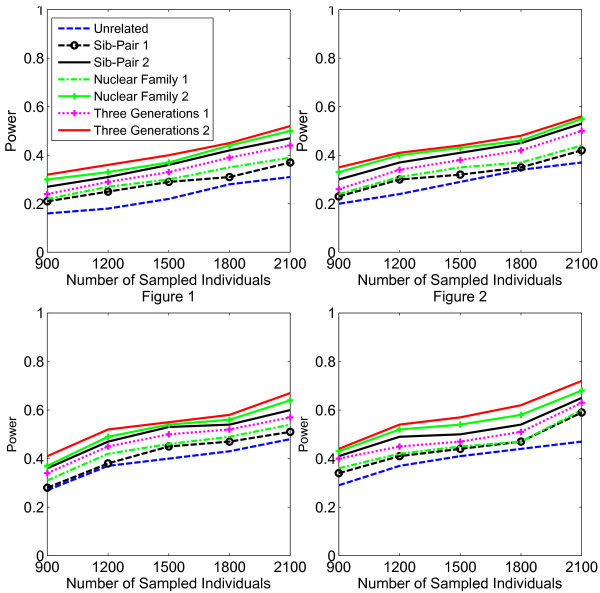
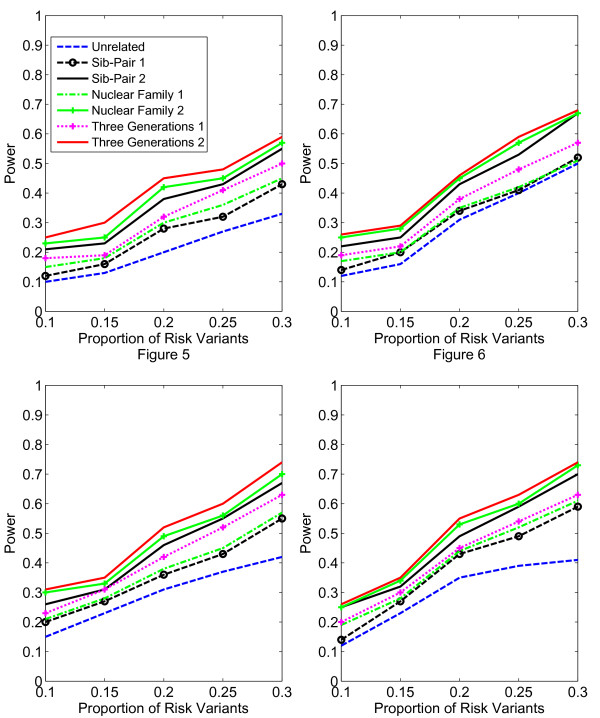
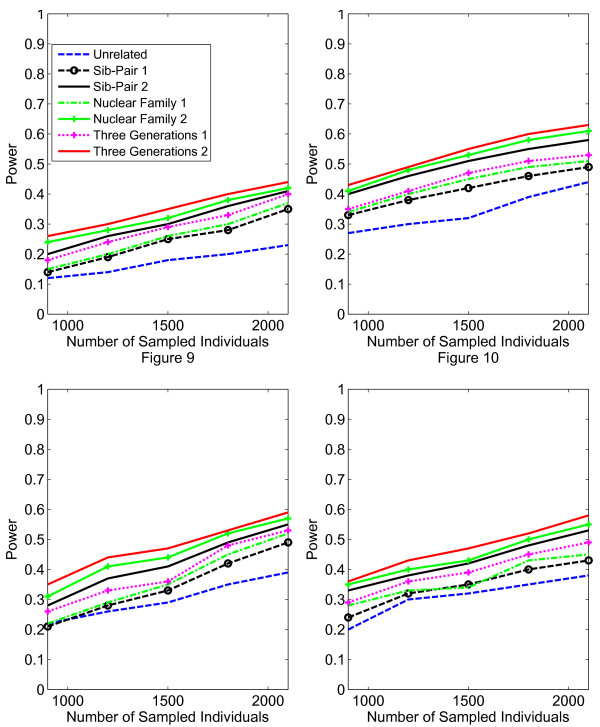
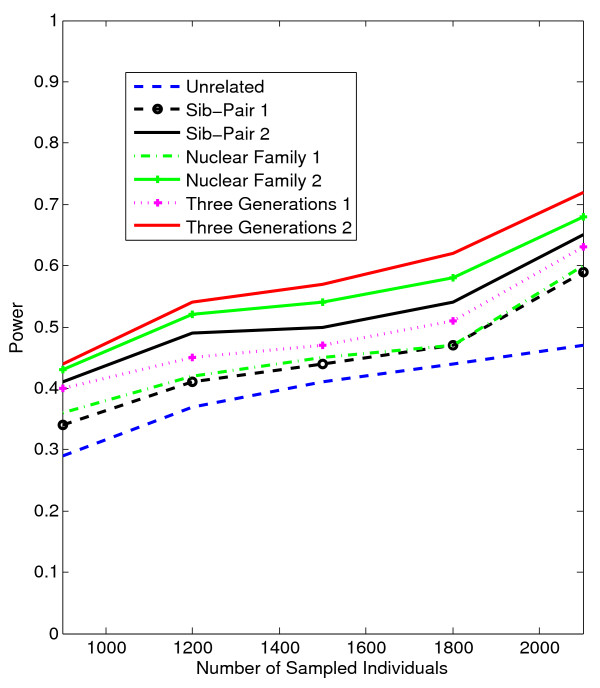
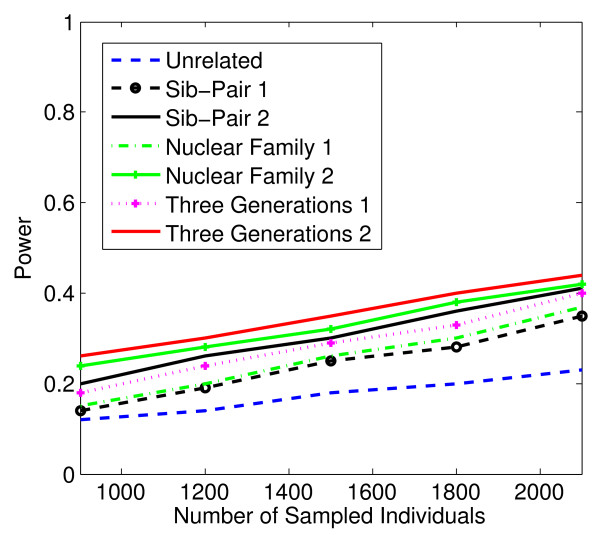
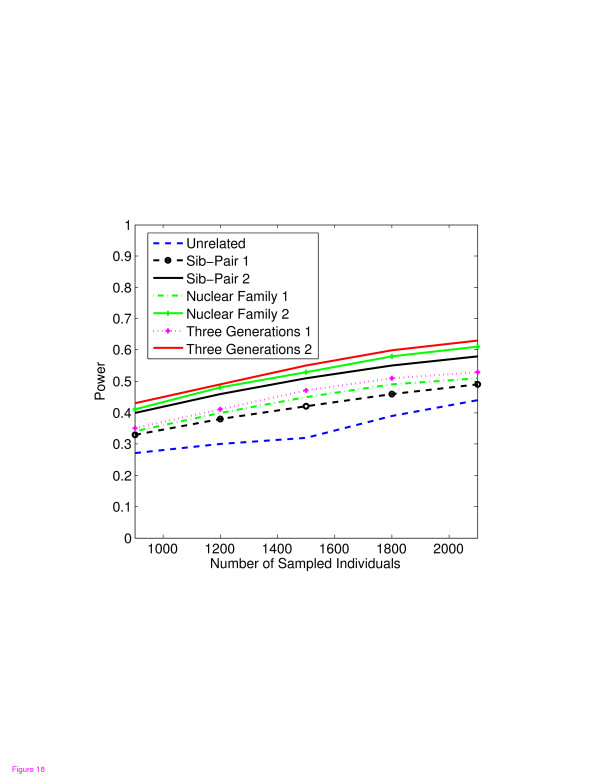
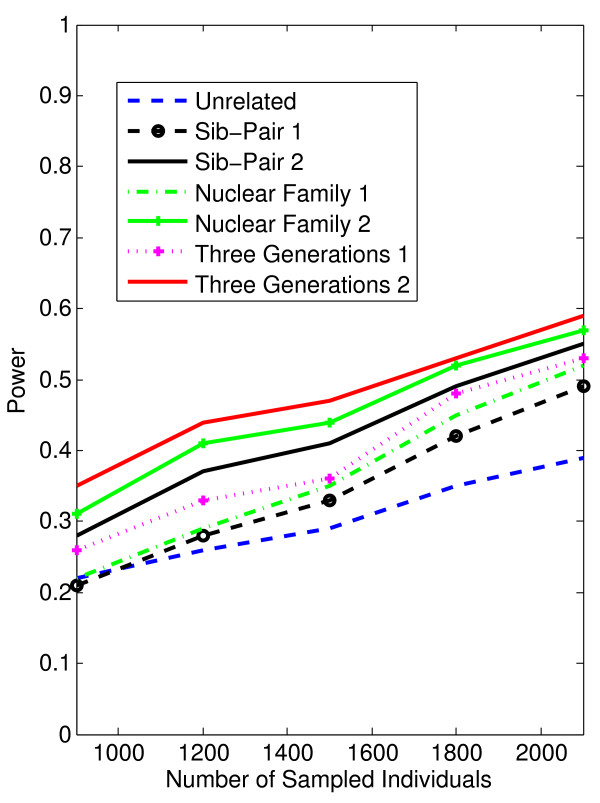
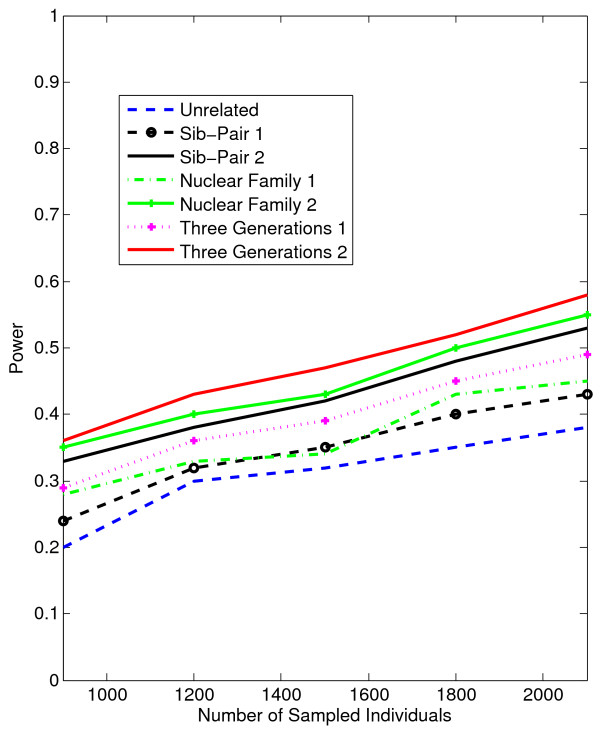
Results: Our working hypothesis was that, since rare variants are concentrated in families with multiple affected individuals, pedigree-based statistics should detect rare variants more powerfully than population-based statistics. To evaluate how well our new pedigree-based statistics perform in association studies, we develop a general framework for sequence-based association studies capable of handling data from pedigrees of various types and also from unrelated individuals. In short, we developed a procedure for transforming population-based statistics into tests for family-based associations. Furthermore, we modify two existing tests, the weighted sum-square test and the variable-threshold test, and apply both to our family-based collapsing methods. We demonstrate that the new family-based tests are more powerful than corresponding population-based test and they generate a reasonable type I error rate.To demonstrate feasibility, we apply the newly developed tests to a pedigree-based GWAS data set from the Framingham Heart Study (FHS). FHS-GWAS data contain approximately 5000 uncommon variants with frequencies less than 0.05. Potential association findings in these data demonstrate the feasibility of the software PB-STAR (note, PB-STAR is now freely available to the public).
Conclusion: Our tests show that when analyzing for rare variants, a pedigree-based design is more powerful than a population-based case-control design. We further demonstrate that a pedigree-based statistic's power to detect rare variants increases in direct relation to the proportion of affected individuals within the pedigree.
Figures
Similar articles
-
The power comparison of the haplotype-based collapsing tests and the variant-based collapsing tests for detecting rare variants in pedigrees.BMC Genomics. 2014 Jul 28;15(1):632. doi: 10.1186/1471-2164-15-632. BMC Genomics. 2014. PMID: 25070353 Free PMC article.
-
Family-based association studies for next-generation sequencing.Am J Hum Genet. 2012 Jun 8;90(6):1028-45. doi: 10.1016/j.ajhg.2012.04.022. Am J Hum Genet. 2012. PMID: 22682329 Free PMC article.
-
Association studies for next-generation sequencing.Genome Res. 2011 Jul;21(7):1099-108. doi: 10.1101/gr.115998.110. Epub 2011 Apr 26. Genome Res. 2011. PMID: 21521787 Free PMC article.
-
Family studies to find rare high risk variants in migraine.J Headache Pain. 2017 Dec;18(1):32. doi: 10.1186/s10194-017-0729-y. Epub 2017 Mar 2. J Headache Pain. 2017. PMID: 28255817 Free PMC article. Review.
-
The role of large pedigrees in an era of high-throughput sequencing.Hum Genet. 2012 Oct;131(10):1555-63. doi: 10.1007/s00439-012-1190-2. Epub 2012 Jun 20. Hum Genet. 2012. PMID: 22714655 Free PMC article. Review.
Cited by
-
Pathway-based approach using hierarchical components of collapsed rare variants.Bioinformatics. 2016 Sep 1;32(17):i586-i594. doi: 10.1093/bioinformatics/btw425. Bioinformatics. 2016. PMID: 27587678 Free PMC article.
-
The power comparison of the haplotype-based collapsing tests and the variant-based collapsing tests for detecting rare variants in pedigrees.BMC Genomics. 2014 Jul 28;15(1):632. doi: 10.1186/1471-2164-15-632. BMC Genomics. 2014. PMID: 25070353 Free PMC article.
-
Amish revisited: next-generation sequencing studies of psychiatric disorders among the Plain people.Trends Genet. 2013 Jul;29(7):412-8. doi: 10.1016/j.tig.2013.01.007. Epub 2013 Feb 17. Trends Genet. 2013. PMID: 23422049 Free PMC article. Review.
-
A multistep approach to single nucleotide polymorphism-set analysis: an evaluation of power and type I error of gene-based tests of association after pathway-based association tests.BMC Proc. 2016 Oct 18;10(Suppl 7):349-355. doi: 10.1186/s12919-016-0055-4. eCollection 2016. BMC Proc. 2016. PMID: 27980661 Free PMC article.
-
A complete pedigree-based graph workflow for rare candidate variant analysis.Genome Res. 2022 May;32(5):893-903. doi: 10.1101/gr.276387.121. Epub 2022 Apr 28. Genome Res. 2022. PMID: 35483961 Free PMC article.
References
Publication types
MeSH terms
Grants and funding
LinkOut - more resources
Full Text Sources
Medical
Research Materials
