

1D and 2D annotation enrichment: a statistical method integrating quantitative proteomics with complementary high-throughput data
- PMID: 23176165
- PMCID: PMC3489530
- DOI: 10.1186/1471-2105-13-S16-S12
1D and 2D annotation enrichment: a statistical method integrating quantitative proteomics with complementary high-throughput data
Abstract
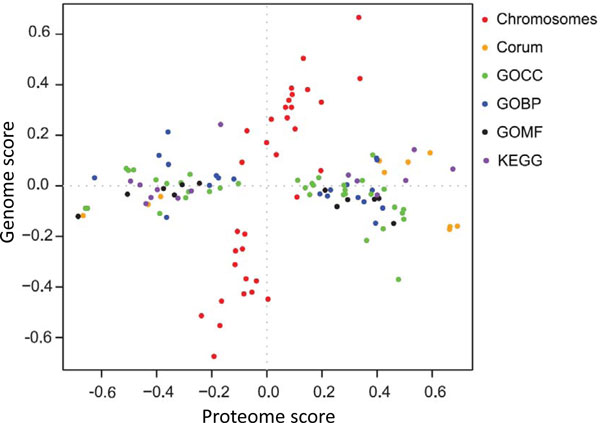
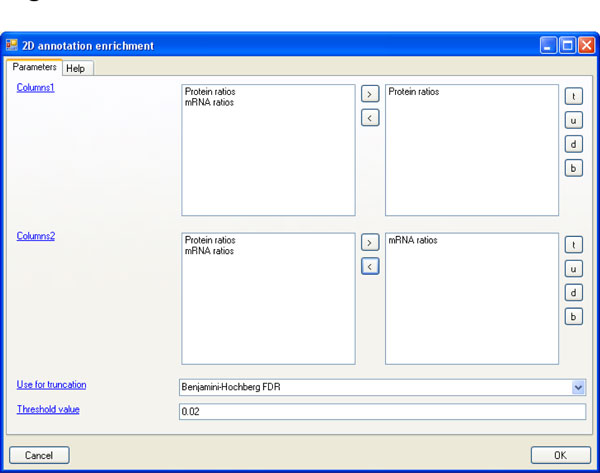
Quantitative proteomics now provides abundance ratios for thousands of proteins upon perturbations. These need to be functionally interpreted and correlated to other types of quantitative genome-wide data such as the corresponding transcriptome changes. We describe a new method, 2D annotation enrichment, which compares quantitative data from any two 'omics' types in the context of categorical annotation of the proteins or genes. Suitable genome-wide categories are membership of proteins in biochemical pathways, their annotation with gene ontology terms, sub-cellular localization, presence of protein domains or membership in protein complexes. 2D annotation enrichment detects annotation terms whose members show consistent behavior in one or both of the data dimensions. This consistent behavior can be a correlation between the two data types, such as simultaneous up- or down-regulation in both data dimensions, or a lack thereof, such as regulation in one dimension but no change in the other. For the statistical formulation of the test we introduce a two-dimensional generalization of the nonparametric two-sample test. The false discovery rate is stringently controlled by correcting for multiple hypothesis testing. We also describe one-dimensional annotation enrichment, which can be applied to single omics data. The 1D and 2D annotation enrichment algorithms are freely available as part of the Perseus software.
Figures
References
-
- Aebersold R, Mann M. Mass spectrometry-based proteomics. Nature. 2003;422:198–207. - PubMed
-
- Ong SE. et al.Stable isotope labeling by amino acids in cell culture, SILAC, as a simple and accurate approach to expression proteomics. Mol Cell Proteomics. 2002;1:376–386. - PubMed
-
- Luber CA et al. Quantitative proteomics reveals subset-specific viral recognition in dendritic cells. Immunity. pp. 279–289. - PubMed
-
- de Godoy LM. et al.Comprehensive mass-spectrometry-based proteome quantification of haploid versus diploid yeast. Nature. 2008;455:1251–1254. - PubMed
-
- Cox J, Mann M. Is proteomics the new genomics? Cell. 2007;130:395–398. - PubMed
MeSH terms
Substances
LinkOut - more resources
Full Text Sources
Other Literature Sources
Medical
