. 2012 Dec 27;2(6):1593-606.
doi: 10.1016/j.celrep.2012.10.016. Epub 2012 Nov 21.

Planar cell polarity controls pancreatic beta cell differentiation and glucose homeostasis

Affiliations

Planar cell polarity controls pancreatic beta cell differentiation and glucose homeostasis

Cedric Cortijo et al. Cell Rep. .

Abstract

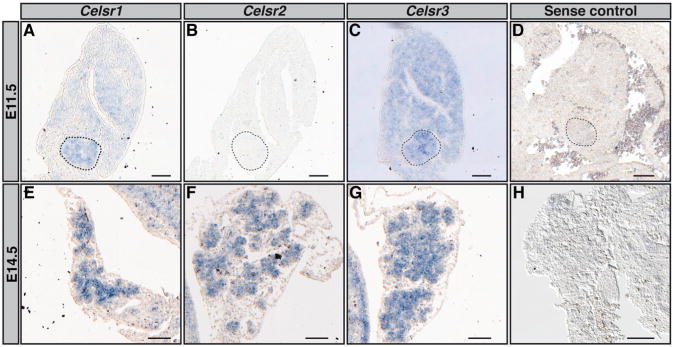
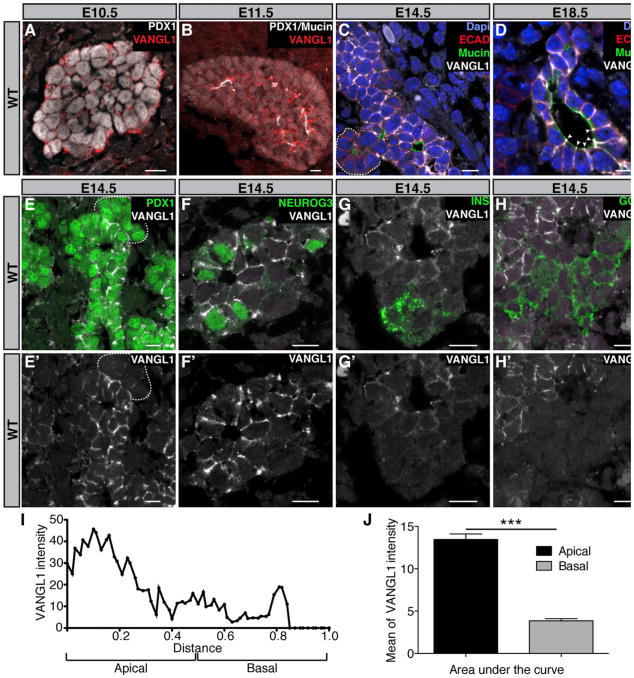
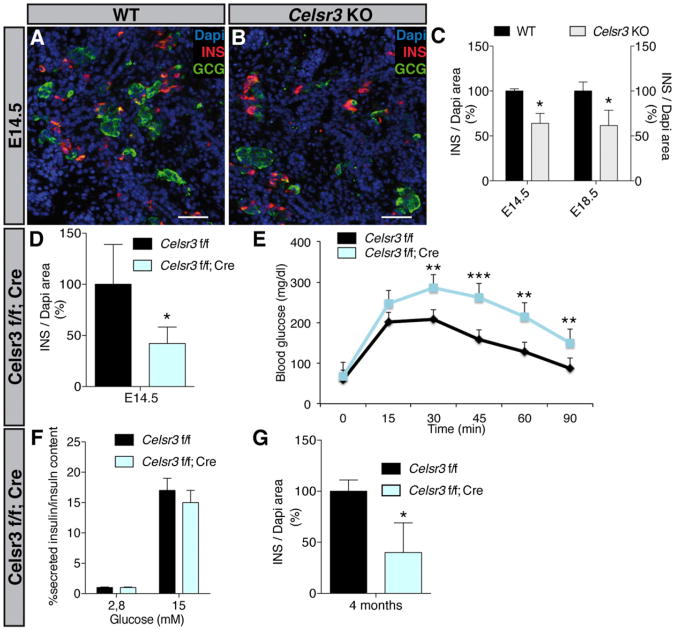
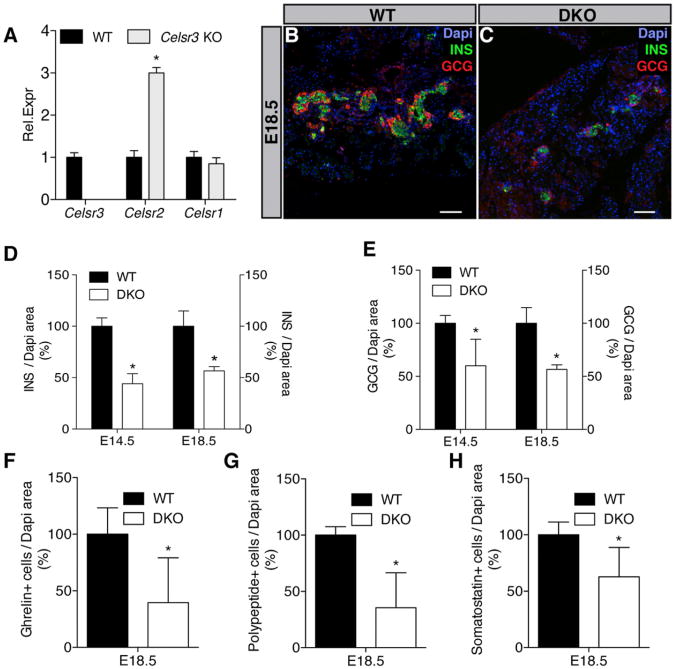
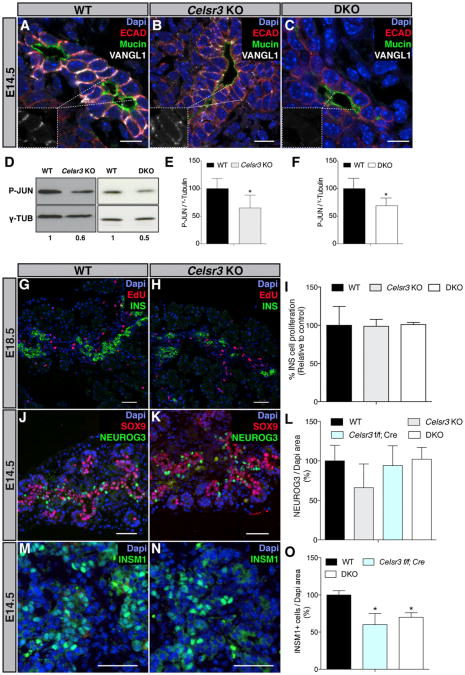
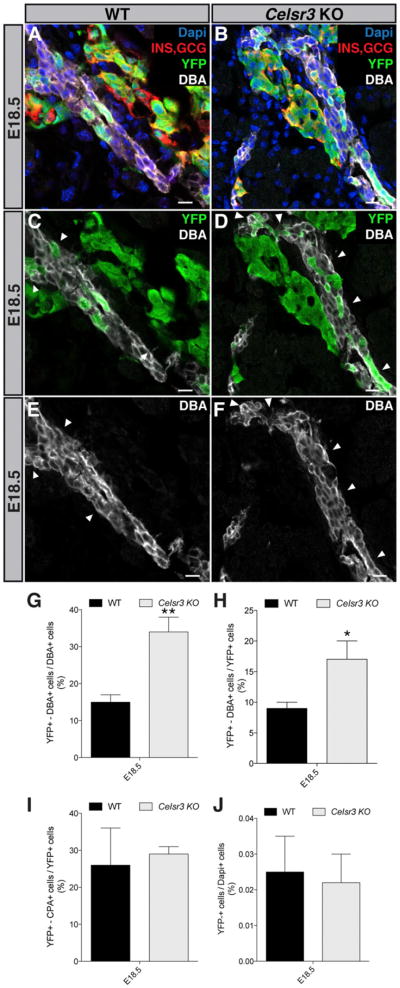
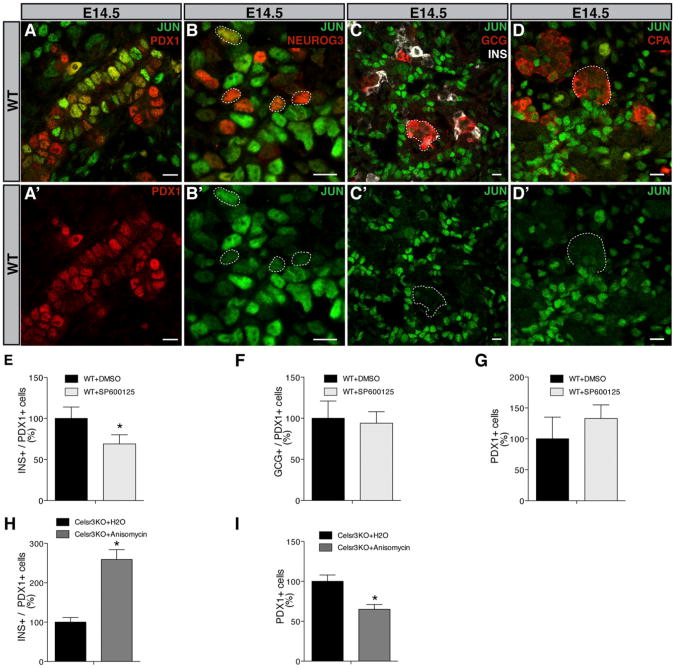
Planar cell polarity (PCP) refers to the collective orientation of cells within the epithelial plane. We show that progenitor cells forming the ducts of the embryonic pancreas express PCP proteins and exhibit an active PCP pathway. Planar polarity proteins are acquired at embryonic day 11.5 synchronously to apicobasal polarization of pancreas progenitors. Loss of function of the two PCP core components Celsr2 and Celsr3 shows that they control the differentiation of endocrine cells from polarized progenitors, with a prevalent effect on insulin-producing beta cells. This results in a decreased glucose clearance. Loss of Celsr2 and 3 leads to a reduction of Jun phosphorylation in progenitors, which, in turn, reduces beta cell differentiation from endocrine progenitors. These results highlight the importance of the PCP pathway in cell differentiation in vertebrates. In addition, they reveal that tridimensional organization and collective communication of cells are needed in the pancreatic epithelium in order to generate appropriate numbers of endocrine cells.


Figures

Figure 1
Figure 1. Celsr1, Celsr2, and Celsr3 Are Expressed in the Epithelium of the Pancreas
(A–H) In situ hybridization detecting Celsr13 mRNA expression was performed on 8 μm sections at E11.5 (A–C) and E14.5 (E–G). Celsr1 (A) and Celsr3 (C) are detected at E11.5, but not Celsr2 (B). Celsr1 (E), Celsr2 (F), and Celsr3 (G) are expressed in the pancreatic epithelium at E14.5. Sense probes for Celsr13 exhibited no staining as shown for Celsr3 (D and H). (A–D) Dotted lines show the pancreatic bud. Scale bars, 25 μm (A–D) and 100 μm (E–H), n = 4. See also Figure S1.
Figure 2
Figure 2. The Planar Cell Polarity Protein VANGL1 Is Restricted to Progenitor Cells
Representative sections of E10.5–E18.5 WT pancreata immunostained against the indicated antigens (A–H). (A) E10.5 pancreas section immunostained with antibodies against PDX1 (white), pancreatic progenitor marker, and VANGL1 (red). No reproducible VANGL1 signal is detected, only random background. (B) E11.5 pancreas section immunostained with antibodies against PDX1, Mucin1 (white), apical marker, and VANGL1 (red). VANGL1 is enriched close to the apical surface of cells. (C and D) E14.5–E18.5 pancreas sections stained with Dapi (blue) and antibodies against ECAD (red), epithelial marker, Mucin1 (green), and VANGL1 (white). VANGL1 is expressed in the ductal compartment but not in the exocrine compartment delimited by the dotted line, preferentially at the apicolateral surface of cells (arrowhead). (E–H) E14.5 pancreas sections immunostained with antibodies against PDX1, NEUROG3, endocrine progenitor marker, Insulin (INS) or Glucagon (GCG) (green), and VANGL1 (white). PDX1+ and NEUROG3+ cells are VANGL1+, whereas INS+, GCG+ cells and the acinar compartment (dotted line) are VANGL1. (E′–H′) Only VANGL1 (white) is shown. Scale bars, 10 μm. (I) Localization of VANGL1 along the lateral membrane of cells. Measurement of VANGL1 intensity signal at E18.5 along the apicobasal axis of the membrane shows apredominant expression at the apicolateral side of the cell (n = 31). The limit between apical and basal side of the membrane is positioned at the middle of the absolute length of the membrane. The distance from the apical (Mucin1) to the basal (mesenchyme) is set to normalize between the different cells. (J) Area under the curve of apical VANGL1 versus basal VANGL1 intensity (n = 31). ***p < 0.0001. Bars show SDs and p values are calculated according to Mann-Whitney U test.
Figure 3
Figure 3. Celsr3 Deletion Results in Decreased β Cell Population and Glucose Intolerance
(A and B) E14.5 WT and Celsr3 KO serial pancreas sections were stained with Dapi (blue), and antibodies against Insulin (INS; red) and Glucagon (GCG; green). Scale bar, 50 μm. (C and D) INS/Dapi area was quantified at E14.5 and E18.5. In Celsr3 KO embryos, INS area is significantly reduced compared to WT (n = 4), *p < 0.05. (D) E14.5 Celsr3 f/f and Celsr3 f/f; Cre were stained with Dapi (blue) and an antibody against Insulin. INS/Dapi area was quantified at E14.5. In Celsr3 f/f; Cre embryos, INS area is significantly decreased compared to WT (n = 4), *p < 0.05. (E) Intraperitoneal glucose tolerance tests were performed on 4-month-old Celsr3 f/f and Celsr3 f/f; Cre mice, fasted for 16 hr. Glucose (2 g/kg) was administered at time 0. Each point represents the mean of nine mice. Basal fasting blood glucose levels are similar between the two groups of mice. The Celsr3 f/f; Cre mice exhibit significantly higher blood glucose levels. (n = 9), **p < 0.001, ***p < 0.0001. (F) Insulin secretion normalized to total Insulin content in Celsr3 f/f and Celsr3 f/f; Cre islets at the indicated glucose concentrations (n = 4 mice for each genotype). No differences are observed. (G) INS/Dapi area was quantified at 4 months. In Celsr3 f/f; Cre adults, INS area is significantly decreased compared to WT (n = 4), *p < 0.05. Bars show SDs and p values are calculated according to Mann-Whitney U test. See also Figure S2.
Figure 4
Figure 4. Celsr3 and Celsr2 Promote Endocrine Cell Differentiation
(A) qRT-PCR analysis on E14.5 WT and Celsr3 KO embryos shows an increase in the relative expression of Celsr2 (n = 4), *p < 0.05. (B and C) Serial pancreas sections from E18.5 WT and Celsr2+3 DKO embryos (DKO) were stained with Dapi (blue) and antibodies against INS (red) and GCG (green). Scale bar, 100 μm. (D) At E14.5 and E18.5, INS/Dapi area was quantified. In DKO embryos, INS area is decreased compared to WT (n = 4), *p < 0.05. (E) At E14.5 and E18.5, GCG/Dapi area was quantified. In DKO embryos, GCG area is decreased compared to WT (n = 4), *p < 0.05. (F–H) The Ghrelin+, Pancreatic Polypeptide+, and Somatostatin+ cells were quantified at E18.5. In DKO embryos, Ghrelin+, Pancreatic Polypeptide+, and Somatostatin+ cells are decreased compared to WT (n = 4), *p < 0.05. Bars show SDs and p values are calculated according to Mann-Whitney U test. See also Figure S3.
Figure 5
Figure 5. CELSR2+3 Function via PCP Signaling and Control Endocrine Differentiation Downstream of NEUROG3
(A–C) E14.5 WT, Celsr3 KO, and Celsr2+3 DKO serial pancreas sections were stained with Dapi (blue), and antibodies against ECAD (red), epithelial marker, Mucin1 (green), and VANGL1 (white). Scale bar, 50 μm. VANGL1 is reduced at the plasma membrane of Celsr3 KO and almost absent in Celsr2+3 DKO (n = 4). (D) Western blot against phospho-JUN. Celsr3 and Celsr2+3 deletion resulted in lower PCP signaling level (n = 3 independent experiments, each on three pooled E14.5 pancreas per lane). (E and F) Mean of the quantification of the band intensity for Celsr3 KO and Celsr2+3 DKO (n = 3). *p < 0.05. Bars show SDs and p values are calculated according to t test, hypothesizing a standard normal distribution. (G and H) Serial pancreas sections of E14.5 WT and Celsr3 KO were stained with Dapi (blue) EdU (red), proliferation marker, and INS (green). Scale bar, 50 μm. (I) The percentage of Insulin+ cells that costained with EdU is not different between WT, Celsr3 KO, and Celsr 2+3 DKO embryos (n = 4). (J and K) Serial pancreas sections of E14.5 WT and Celsr3 KO were stained with Dapi (blue) and antibodies against SOX9 (red) and NEUROG3 (green). Scale bar, 50 μm. (L) Quantification of the number of NEUROG3+ cells in WT, Celsr3 KO, Celsr3 f/f; Cre, and Celsr 2+3 DKO embryos did not show any difference (n = 4). (M and N) Serial pancreas sections of E14.5 WT and Celsr3 KO embryos were stained with Dapi (blue) and antibodies against INSM1 (green). Scale bar, 50 μm. (O) Quantification of INSM1+ cells shows a significant decrease in Celsr3 f/f; Cre and Celsr2+3 DKO compared to the WT. (n = 4), *p < 0.05. Bars show SDs and p values are calculated according to the Mann-Whitney U test. See also Figures S4 and S6.
Figure 6
Figure 6. Fate of Endocrine Progenitor Cells in Celsr3 KO Pancreas
(A–F) E18.5Neurog3-Cre; Rosa26-YFP mice harboring WT or Celsr3 KO alleles immunostained with antibodies against DBA-lectin, ductal marker (white), YFP (green), and Insulin/Glucagon, endocrine marker (red). Arrowheads show YFP+ cells that are DBA+. (G) Number of cells that are YFP+ and DBA+, normalizedon the total DBA+ cells in pancreas. In Celsr3 KO embryos we observed that 35% progeny of NEUROG3-expressing cells remain confined within the DBA+ epithelium cells compared to 15% in the WT (n = 3). (H) Number of cells that are YFP+ and DBA+, normalized to the total YFP+ cells in pancreas (n = 3). (I) Number of cells that are YFP+ and CPA+, normalized to the total YFP+ cells in pancreas (n = 3). (J) Number of cells that are YFP+, normalized to the total Dapi+ cells in pancreas (n = 3). No difference was observed. Scale bar, 10 μm. Bars show SDs and p values are calculated according to the t test.
Figure 7
Figure 7. Celsr2+3 Control Beta Cell Differentiation via the JNK Signaling Pathway
(A-D) E14.5 pancreas section immunostained with antibodies against PDX1, NEUROG3, INS and GCG, CPA, and Jun. (A and A′) PDX1+ progenitors located in cords are JUN+. (B-D′) Most of the NEUROG3+ endocrine progenitors are JUN+, although at a lower level than neighboring PDX1+ cells, whereas INS+ and CGC+ cells (endocrine cells) and CPA+ cells (acinar cells) are JUN. (A′) PDX1 only (red). (B′-D′) Only JUN (green). Scale bar, 10 μm. (E-G) E12.5 WT pancreatic explants were treated with DMSO or with 5 μM SP600125, a JNK inhibitor, diluted in DMSO for 48 hr. Quantification of immunostained explants for Insulin, Glucagon, and PDX1. The number of INS+/PDX1+ cells is significantly decreased (n = 4), *p < 0.05. (H and I) Rescue experiment treating E12.5 Celsr3 KO pancreatic explants with water or with 50 ng/ml of anisomycin, a JNK agonist, diluted in water for 48 hr. Quantification of immunostained explants for Insulin and PDX1. The number of PDX1+ cells is reduced by anisomycin. The number of INS+/PDX1+ cells is significantly increased (n = 4), *p < 0.05. Quantifications of INS cells were normalized to PDX1 to measure a differentiation flux from progenitors in these experiments where PDX1 cell numbers were affected by one of the compounds. Although some PDX1+ cells also express Insulin, their relative number is negligible. Bars show SDs and p values are calculated according to the Mann-Whitney U test. See also Figure S5.

Similar articles

Cited by

References

    1. Ahlgren U, Jonsson J, Edlund H. The morphogenesis of the pancreatic mesenchyme is uncoupled from that of the pancreatic epithelium in IPF1/PDX1 -deficient mice. Development. 1996;122:1409–1416. - PubMed
    1. Bacallao RL, McNeill H. Cystic kidney diseases and planar cell polarity signaling. Clin Genet. 2009;75:107–117. - PubMed
    1. Bastock R, Strutt H, Strutt D. Strabismus is asymmetrically localised and binds to Prickle and Dishevelled during Drosophila planar polarity patterning. Development. 2003;130:3007–3014. - PubMed
    1. Bennett BL, Sasaki DT, Murray BW, O'Leary EC, Sakata ST, Xu W, Leisten JC, Motiwala A, Pierce S, Satoh Y, et al. SP600125, an anthrapyrazolone inhibitor of Jun N-terminal kinase. Proc Natl Acad Sci USA. 2001;98:13681–13686. - PMC - PubMed
    1. Boutros M, Paricio N, Strutt DI, Mlodzik M. Dishevelled activates JNK and discriminates between JNK pathways in planar polarity and wingless signaling. Cell. 1998;94:109–118. - PubMed

Publication types

MeSH terms