. 2012 Nov 29;2(5):1411-24.
doi: 10.1016/j.celrep.2012.10.017. Epub 2012 Nov 21.

Linking DNA methyltransferases to epigenetic marks and nucleosome structure genome-wide in human tumor cells

Affiliations

Linking DNA methyltransferases to epigenetic marks and nucleosome structure genome-wide in human tumor cells

Bilian Jin et al. Cell Rep. .

Abstract

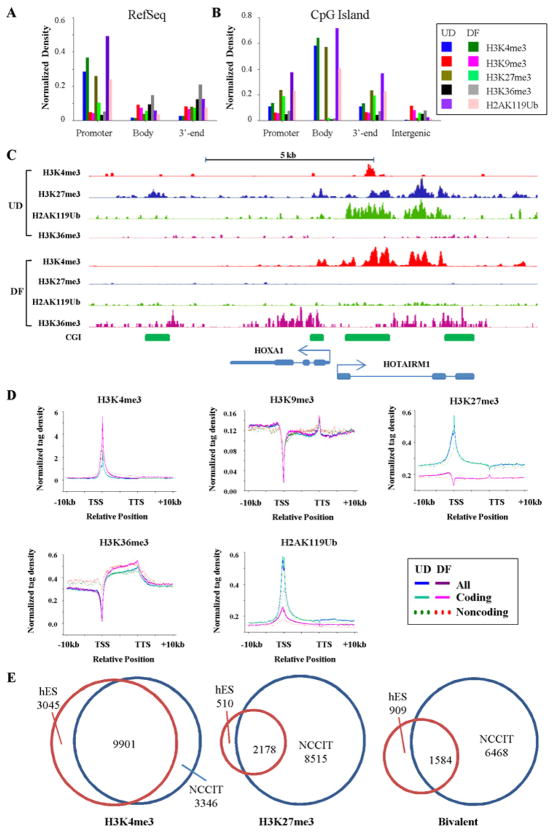
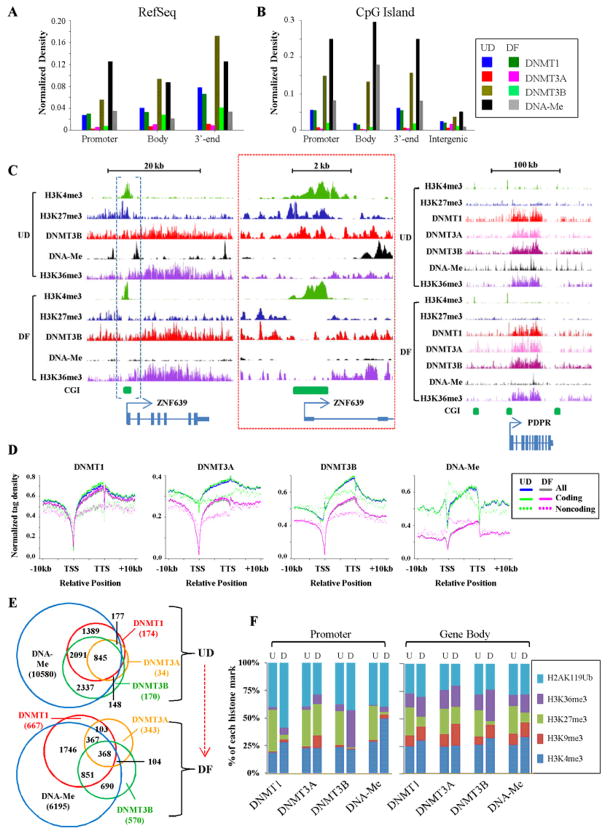
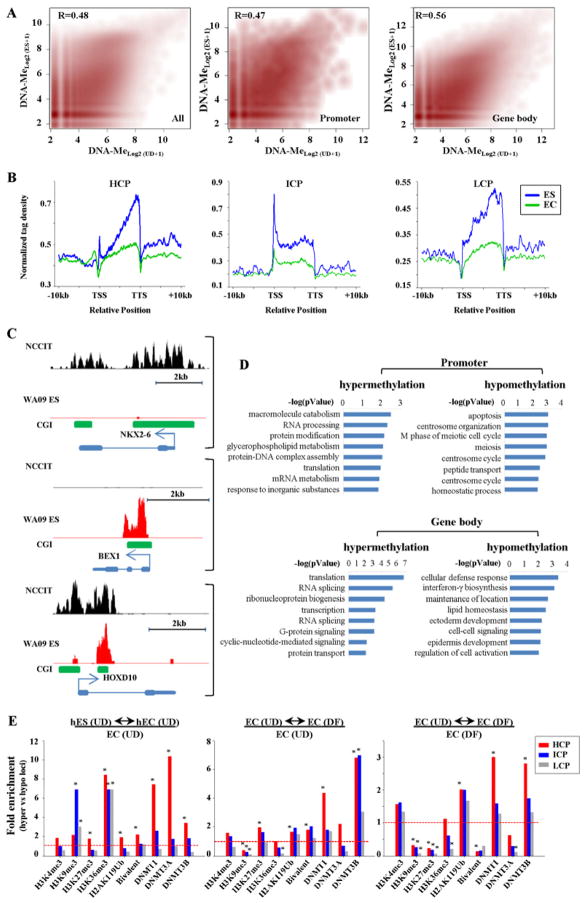
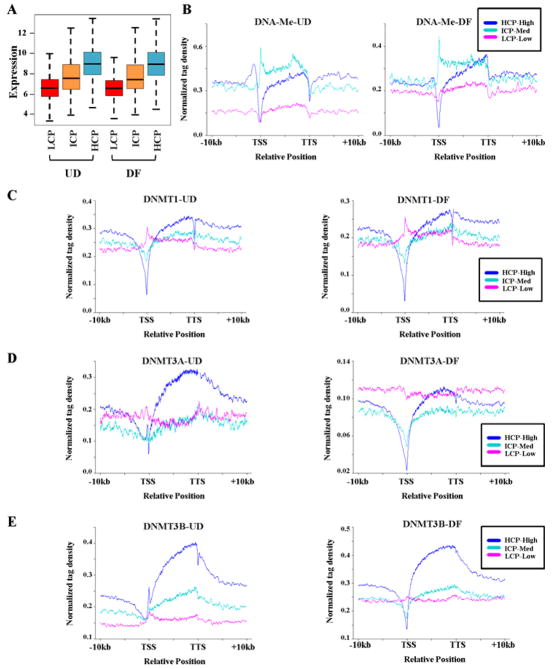
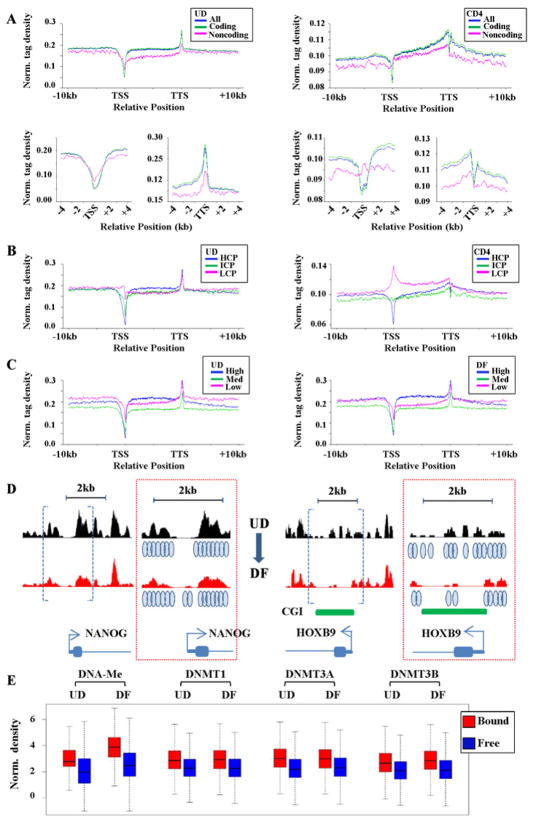
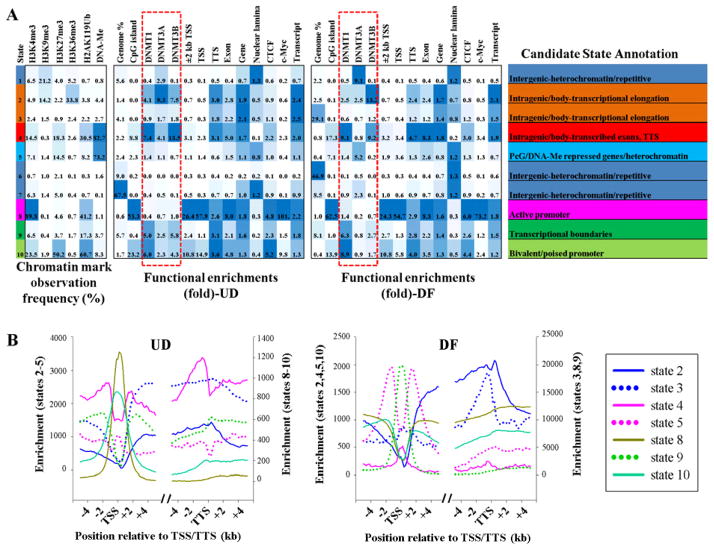
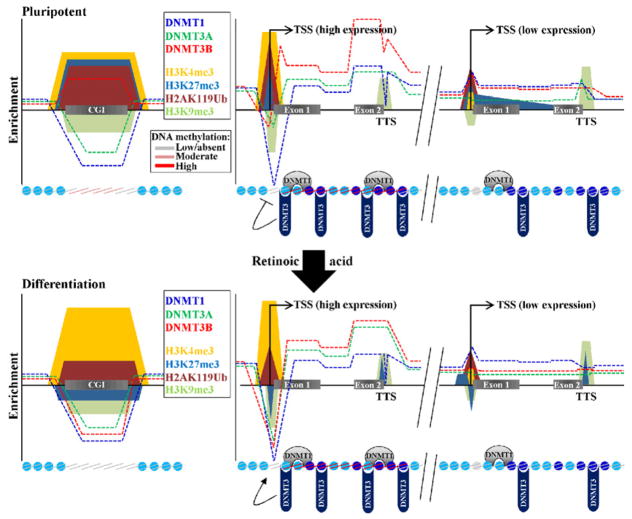
DNA methylation, mediated by the combined action of three DNA methyltransferases (DNMT1, DNMT3A, and DNMT3B), is essential for mammalian development and is a major contributor to cellular transformation. To elucidate how DNA methylation is targeted, we mapped the genome-wide localization of all DNMTs and methylation, and examined the relationships among these markers, histone modifications, and nucleosome structure in a pluripotent human tumor cell line in its undifferentiated and differentiated states. Our findings reveal a strong link between DNMTs and transcribed loci, and that DNA methylation is not a simple sum of DNMT localization patterns. A comparison of the epigenomes of normal and cancerous stem cells, and pluripotent and differentiated states shows that the presence of at least two DNMTs is strongly associated with loci targeted for DNA hypermethylation. Taken together, these results shed important light on the determinants of DNA methylation and how it may become disrupted in cancer cells.


Figures

Figure 1
Figure 1. Global analysis of histone modification patterns in EC cells
(A) Relationships between genomic features and ChIP-seq peaks for five histone modifications in undifferentiated (UD) and seven day RA-differentiated (DF) NCCIT cells. The Y-axis represents the fraction (proportion) of the total length of the peaks in a genomic feature normalized to the total length of that feature present in the genome. Features were defined with hg19 RefSeq gene as: promoter (TSS-1kb), gene body (TSS to TTS), and 3′-end (TTS+1kb). (B) Enrichment of histone modifications in CpG islands (CGIs) based on context as in part A. (C) Representative ChIP-seq results at a locus which transitions from bivalent to monovalent during differentiation. Bent arrow: TSS (+1). (D) Normalized tag distribution profiles of five histone modifications across intragenic regions before and after differentiation. Each gene body is normalized to 0–100%, from the TSS to the TTS, with 10kb upstream (promoter) and 10 kb downstream of the gene body shown. Tag densities were normalized to total mapped read numbers in each sample. Different colors are used to represent UD or DF conditions and genes are further stratified by protein coding potential. (E) Venn diagrams summarizing overlap between histone modifications and bivalent loci in UD NCCIT compared to human ES cells.
Figure 2
Figure 2. DNMT1, DNMT3A, DNMT3B, and DNA methylation show distinct and overlapping distributions across the NCCIT genome
(A) Enrichment of each enzymatically active DNA methyltransferase and DNA methylation within intragenic features of undifferentiated (UD) and RA-differentiated (DF) NCCIT cells as described in Fig. 1. (B) Enrichment of DNMTs and histone modifications within CpG islands (CGIs) based on context. (C) Representative ChIP-seq and MBD-seq results for the indicated DNMTs, DNA methylation, and histone modifications at two loci. In the left panel, the region enclosed by blue brackets is enlarged in the center (red boxed region), to highlight reduced DNMT3B binding at the TSS upon differentiation. (D) Normalized distribution profiles of DNMTs and DNA methylation across intragenic regions in NCCIT cells before and after differentiation as described in Fig. 1. (E) Venn diagrams summarizing overlap between genes marked by at least one DNMT and DNA methylation in UD and DF NCCIT cells. Further breakdown by promoter and body is shown in Fig. S5D. (F) Proportion of each histone mark overlaping with DNMT-bound or DNA methylated regions at promoters (left) or gene bodies (right). U-undifferentiated, D-RA-differentiated NCCIT.
Figure 3
Figure 3. DNA methylation and DNMT localization in normal versus malignant stem cells and features of loci targeted for methylation
(A) MBD-seq data from pluripotent NCCIT and WA09 human ES cells compared over the entire genome (left), promoters (middle), and gene bodies (right). Pearson correlation coefficients are shown. (B) Normalized tag distribution profiles of DNA methylation across gene bodies in undifferentiated hES and NCCIT cells. (C) Representative MBD-seq results in UD NCCIT (black) compared to WA09 human ES cells (red) at loci hypomethylated (top, NKX2-6), hypermethylated (middle, BEX1), or similarly methylated (bottom, HOXD10) in WA09 relative to NCCIT. (D) Biological processes enriched in differentially methylated genes in NCCIT (UD) compared to WA09 using DAVID. (E) Left panel. Enrichment of DNMTs, histone modifications, and bivalent status at loci hypermethylated in EC (undifferentiated) relative to ES, compared to those loci that are hypomethylated in EC relative to ES cells. Middle-right panels. Enrichment of DNMTs and histone marks at loci that become hypermethylated upon RA-induced differentiation of NCCIT cells, relative to those loci that become hypomethylated upon differentiation (4X or greater change). Enrichments are relative to the histone modifications and DNMT binding patterns derived from NCCIT in the undifferentiated condition in the middle panel and the differentiated condition in the right panel. Significance was assessed using the chi-square test (*p<0.01). Dashed line – 1X enrichment level.
Figure 4
Figure 4. DNA methyltransferases are differentially enriched in gene bodies as a function of expression and promoter CpG density
(A) Relationship between promoter CpG density and expression in NCCIT cells. The box plot shows the relationship between log2 transformed gene expression level (stratified as: low expressed <7, medium expression 7–9, and high expression >9) and promoter CpG densities (HCP, ICP, and LCP). The bottom and top of each box represents the lower and upper quartiles respectively, the bar represents the median, and the whiskers represent the lowest and highest data within 1.5 interquartile range. (B–E) Tag density plots illustrating relationships between DNA methylation/DNMTs and expression stratified into: HCP-High (blue), ICP-Medium (green), and LCP-Low (red) classes. Normalized distribution profiles of (B) DNA methylation, (C) DNMT1, (D) DNMT3A, and (E) DNMT3B in NCCIT cells before (left) and after (right) differentiation.
Figure 5
Figure 5. Relationships between global nucleosome positioning, genomic features, transcription, DNMTs, and DNA methylation
(A) Normalized distribution profiles for nucleosome binding across intragenic regions for all, protein coding, and non-protein coding genes in pluripotent NCCIT cells. MNase-seq data from human CD4 T cells was used to create similar tag density plots. TSS and TTS (+/− 4kb)-centered plots are also shown to emphasize similarities and differences in these regions. (B) Tag density plots for nucleosome distributions across intragenic loci stratified according to promoter CpG density in UD NCCIT (left) and CD4 T cells (right). (C) Nucleosome distribution according to expression level in UD (left) and DF NCCIT (right) conditions. (D) Representative MNase-seq results at two loci that show among the largest change in expression upon differentiation of NCCIT cells. NANOG is down-regulated and this is accompanied by increased nucleosome density at the TSS. HOXB9 is up-regulated and shows the opposite trend in TSS nucleosome density. The browser data enclosed by blue brackets is enlarged at the right of each panel (red boxed region) with blue ovals indicating inferred positions of nucleosomes. (E) Analysis of relationships between DNMT occupancy, DNA methylation, and nucleosome bound versus free (linker) DNA. Using the method described in (Kaplan et al., 2009), nucleosome bound (red) and free (blue) DNA was defined and the correlation between these two states and regions enriched for DNMTs and DNA methylation was calculated. Enrichments are shown as box plots, with the black bar indicating the median, the box defining the first and third quartiles of the data, and whiskers indicating the range (excluding outliers). All bound versus free (linker) comparisons for a given mark are highly significant (P<2×10⁻¹⁶, Student’s two-sample t-test).
Figure 6
Figure 6. Discovery and characterization of chromatin states in NCCIT cells
(A) A multivariate hidden Markov model was used to learn chromatin states jointly across undifferentiated and differentiated NCCIT cells. In the left part of the table, emission parameters that were learned de novo from recurrent combinations of epigenetic marks over the entire genome are shown. Each value represents the frequency of the epigenetic mark at genomic positions corresponding to that particular state. Functional enrichment of different features and candidate state annotations for each state in UD and DF conditions are shown on the right. Blue shading – intensity scaled by column. (B) Comparison of enrichments for states associated with genes (states 2–5, 8–10 only) across the TSS and the TTS regions in UD and DF cells. The break indicates the remainder of the gene body. States are graphed with different scales (right and left y-axes) to highlight their patterns, relative to other states, rather than absolute enrichments.
Figure 7
Figure 7. Summary of key findings and model for targeting DNA methylation based on DNMT occupancy
(A) The top portion of the figure represents summarized schematic enrichments of the indicated epigenetic marks, DNMTs, DNA methylation, and nucleosome positions in undifferentiated NCCIT cells based on our findings. Shown are three features, CGIs, highly expressed loci, and low expressed loci. DNMT enrichments are denoted with dashed lines, histone modifications by colored shapes, nucleosomes by blue circles (darker blue indicates more highly positioned or enriched), and DNA methylation by colored lines on the nucleosomes. Note that in general, DNMTs and DNA methylation are weakly associated with CGIs, except DNMT3B. DNMTs and DNA methylation are much more enriched at highly expressed (and CpG-rich) loci than at low expressed (CpG-poor) loci. The TSS is a nucleosome-free region regardless of expression level but is less pronounced in low expressed genes (gray circle). (B) Epigenetic marks after differentiation of NCCIT cells with retinoic acid. After differentiation of NCCIT, loci with DNMT1 and a DNMT3 tend to acquire DNA methylation and lose the H3K27me3 PcG marker and bivalency (shown by the colored shapes on nucleosomes, based on data in Fig. 3). The TSS and TTS therefore appear to set boundaries on methylation. Breakdown of these boundaries in cancer may permit aberrant methylation spreading into promoters and reduced gene body methylation.

Similar articles

Cited by

References

    1. Adamo A, Sese B, Boue S, Castano J, Paramonov I, Barrero MJ, Izpisua Belmonte JC. LSD1 regulates the balance between self-renewal and differentiation in human embryonic stem cells. Nat Cell Biol. 2011;13:652–659. - PubMed
    1. Aran D, Toperoff G, Rosenberg M, Hellman A. Replication timing-related and gene body-specific methylation of active human genes. Hum Mol Genet. 2011;20:670–680. - PubMed
    1. Barski A, Cuddapah S, Cui K, Roh TY, Schones DE, Wang Z, Wei G, Chepelev I, Zhao K. High-resolution profiling of histone methylations in the human genome. Cell. 2007;129:823–837. - PubMed
    1. Baylin SB, Jones PA. A decade of exploring the cancer epigenome - biological and translational implications. Nature Rev Canc. 2011;11:726–734. - PMC - PubMed
    1. Berger SL. The complex language of chromatin regulation during transcription. Nature. 2007;447:407–412. - PubMed

Publication types

MeSH terms

Associated data