. 2012 Nov 21;76(4):713-20.
doi: 10.1016/j.neuron.2012.09.021.

Anterior-posterior direction opponency in the superficial mouse lateral geniculate nucleus

Affiliations

Anterior-posterior direction opponency in the superficial mouse lateral geniculate nucleus

James H Marshel et al. Neuron. .

Abstract

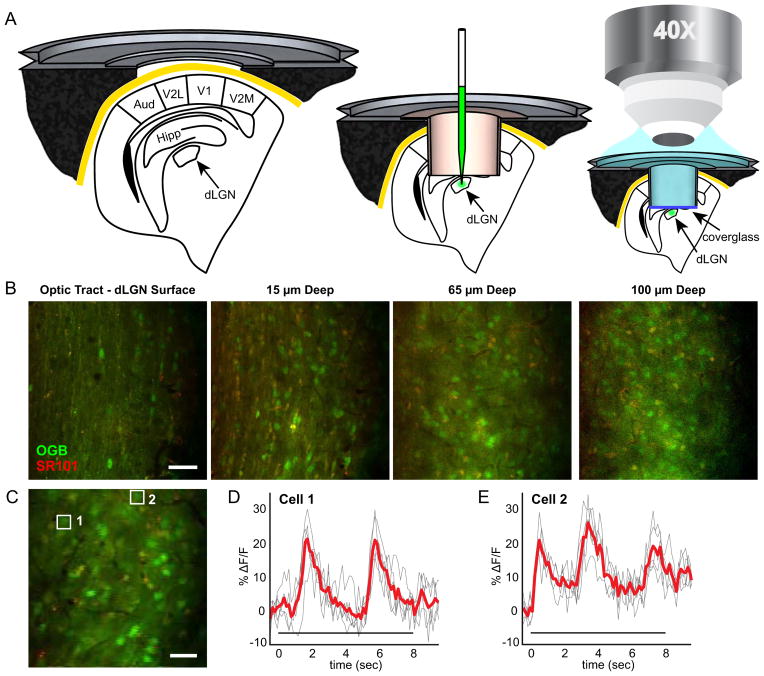
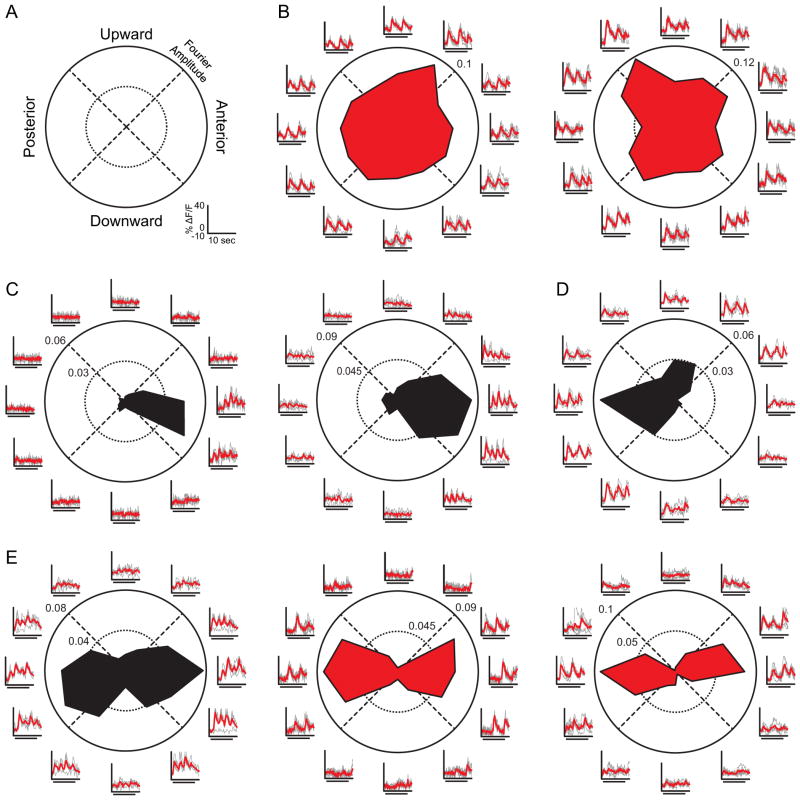
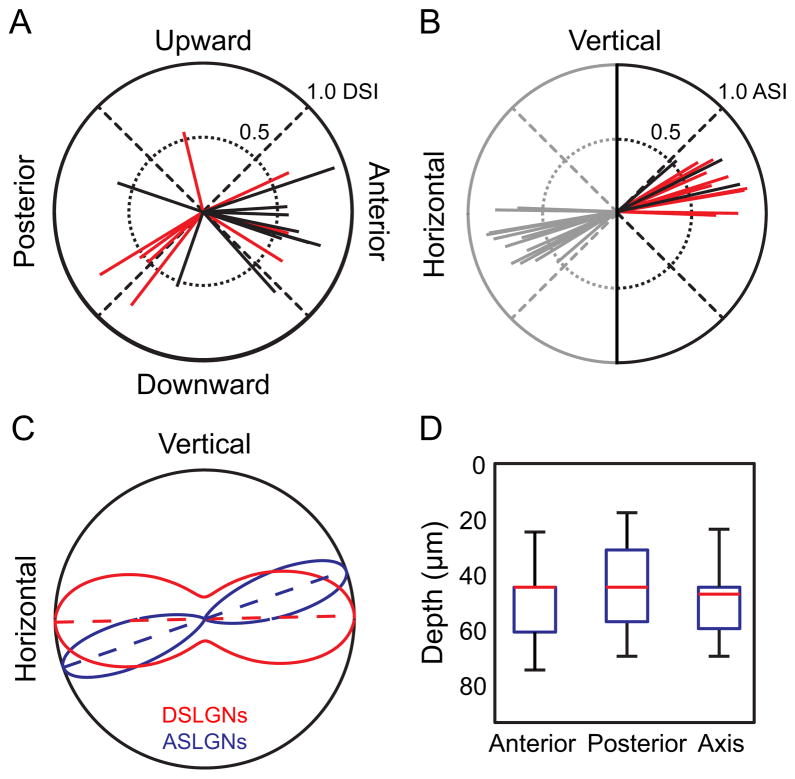
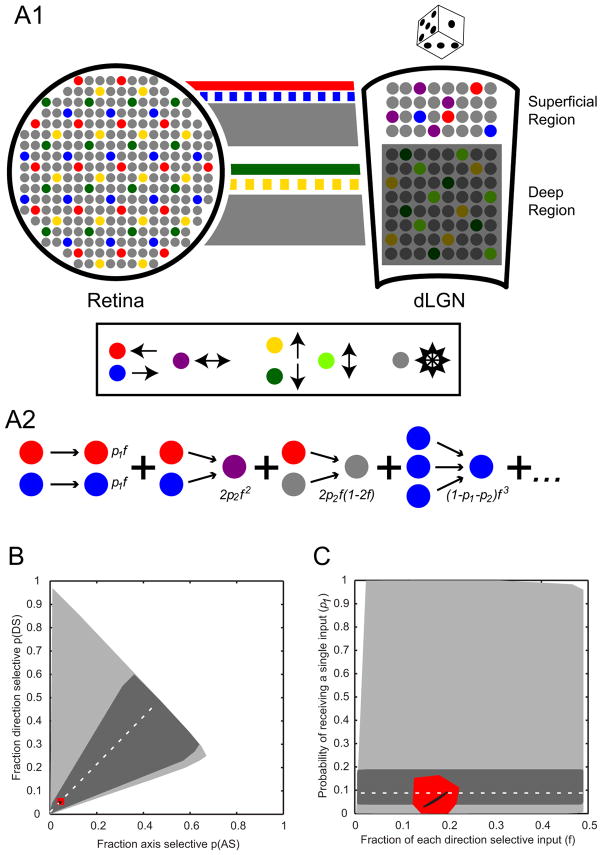
We show functional-anatomical organization of motion direction in mouse dorsal lateral geniculate nucleus (dLGN) using two-photon calcium imaging of dense populations in thalamus. Surprisingly, the superficial 75 μm region contains anterior and posterior direction-selective neurons (DSLGNs) intermingled with nondirection-selective neurons, while upward- and downward-selective neurons are nearly absent. Unexpectedly, the remaining neurons encode both anterior and posterior directions, forming horizontal motion-axis selectivity. A model of random wiring consistent with these results makes quantitative predictions about the connectivity of direction-selective retinal ganglion cell (DSRGC) inputs to the superficial dLGN. DSLGNs are more sharply tuned than DSRGCs. These results suggest that dLGN maintains and sharpens retinal direction selectivity and integrates opposing DSRGC subtypes in a functional-anatomical region, perhaps forming a feature representation for horizontal-axis motion, contrary to dLGN being a simple relay. Furthermore, they support recent conjecture that cortical direction and orientation selectivity emerge in part from a previously undescribed motion-selective retinogeniculate pathway.


Figures

Figure 1
Figure 1. Two-Photon Calcium Imaging of Visual Responses in the Mouse dLGN
(A) Surgery and calcium dye loading procedure as described in Experimental Procedures. Metal frame and tube cross sections, as well as anatomy (Paxinos, G. and Franklin, K. B. J., 2001) are drawn to scale. The microscope objective drawing is not to scale. (B), Images at multiple depths in the dLGN (Movie S1). Lateral is up, anterior is right. (C), Example field of view used for imaging visual responses. (D–E), Change in fluorescence over time (ΔF/F) for neurons indicated by white boxes in (C). Cell 1 (F1 = 7.6 ± 0.4% F/F) responds after Cell 2 (F1 = 5.9 ± 0.7% F/F) indicating slightly shifted positions of their receptive fields relative to the same grating stimulus. Fourier magnitude is unaffected by these shifts in phase (Figure S1). Red line indicates mean over five trials; each trial is a gray line. Stimulus time indicated by bar under waveforms. Scale bars: (B), 50 μm (C), 25 μm.
Figure 2
Figure 2. Direction and Axis Selectivity in the dLGN
(A), Polar plot legend for (B–E), with directions in visual coordinates. Scale bars for fluorescence change (ΔF/F) and time in (B–E) are shown in lower right. (B–E) Examples of non-direction-selective dLGN neurons (B), anterior DS neurons (C), posterior DS neuron (D), and axis-selective neurons (E). Polar plots represent the magnitude of F1 (red) or F2 (black, On-Off) response to each grating direction. Axes outside of the circle show the fluorescence time series, in units of percent change in fluorescence, in response to each direction of the grating. Individual trials (gray) are overlaid with the mean time series (red), where stimulus time (8 seconds) is indicated by bar under waveforms as in (Figure 1D–1E).
Figure 3
Figure 3. The Superficial dLGN is Selective for Horizontal Motion
(A), Each vector on polar plot indicates a DS neuron. Direction of vector indicates direction preference. (B), Each vector indicates an axis-selective neuron. Direction of vector indicates axis preference. Vectors are reflected (gray) for display purposes, and represent the same data as black and red vectors. (A–B), Length of vectors indicates level of direction selectivity (DSI) or axis selectivity (ASI), using the max-null metric (Supplemental Experimental Procedures). Data for all neurons in the dataset are shown in Figure S2, using the resultant metric and the Hotelling T2 test, for all values of DSI and ASI. Black lines indicate On-Off response (F2 modulation) and red lines indicate F1 modulation. (C), Maximum likelihood fit of axial circular Gaussian distributions to the observed populations of direction- and axis-selective neurons from (A–B). Curves represent the axial Gaussian model’s probability of observing a direction- (red) or axis-selective (blue) neuron with a given preferred direction or preferred axis. Dotted lines indicate preferred axis for each population, and curves are normalized to equalize the maximum probability density for visualization. Both populations prefer axes representing horizontal motion. (D), Depth of neuron populations in dLGN dataset depending on stimulus selectivity. Whiskers are complete depth range, boxes are 25th to 75th percentile, and the red line is the median depth. Anterior-, posterior- and axis-selective neurons overlap locations in depth within the superficial ~75 μm of dLGN.
Figure 4
Figure 4. Wiring Model Between Retina and dLGN
(A1) (Left) Schematic representation of mosaics of retinal ganglion cells. Each color represents a different On-Off DSRGC cell type: posterior (red), anterior (blue), upward (yellow), downward (green). Non-direction-selective neurons are gray. (Right, “Superficial Region”) Organization of dLGN showing the superficial dLGN region containing intermingled populations of posterior (red) and anterior (blue) DSLGNs as well as horizontal ASLGNs (purple) and non-direction-selective neurons (gray) as revealed by the current study. (Right, “Deep Region”) Predictions for deeper dLGN, including intermingled upward (yellow) and downward (green) DSLGNs as well as vertical ASLGNs (light green). This region is grayed out because its functional organization remains unknown. Lines between retina and dLGN schematics represent RGC axons. Color conventions are same as rest of figure. The thickness of the lines indicates predicted fraction (f) of overall input from our random wiring model. Solid red and green lines represent known projection patterns of posterior and downward DSRGCs, respectively, whereas dashed blue and yellow lines represent predicted projection patterns of anterior and upward DSRGCs made by the current study. Our random wiring model demonstrates that concentrated, laminar projection patterns of opposing DSRGCs can yield the fractions of DSLGNs and ASLGNs we observe in superficial dLGN given locally random wiring. (A2) Basic probabilistic theory of the model which assumes dLGN neurons receive one (probability = p1), two (p2) or three inputs (1-p1-p2) from retina that drive their selectivity, including a variable for the fraction of anterior and posterior direction selective input (2f). Some examples of individual probabilities are shown (see Table S1 and Supplemental Experimental Procedures). (B, C) Results of the model. (B) All possible ASLGN and DSLGN fractions based on the model without further constraints (light gray area). The fraction of purely single input neurons from Cleland et al., (1971a) (95% binomial C.I. from Wilson interval: dark gray area 0.038 < p1 < 0.19, actual value: dotted line p1 = 0.088) constrains the plausible range of ASLGNs and DSLGNs. The observed fractions of ASLGNs and DSLGNs in our study (95% binomial C.I. from Wilson interval: red area 0.026 < ASLGN fraction < 0.069, 0.033 < DSLGN fraction < 0.079, actual value: black dot ASLGN fraction = 0.043, DSLGN fraction = 0.051) falls within this plausible range. (C) Possible p1 and f values (by varying across all values of p2) corresponding to the differing constraints in (B): unconstrained model (light gray region), constraining p1 to be consistent with the fraction of purely single input neurons from Cleland et al (1971a) (95% C.I.: dark gray region, actual value: dotted line), or constraining the model to be consistent with the experimentally observed ASLGN and DSLGN fractions in this study (95% C.I.: red region, actual value: black curve).

References

    1. Briggman KL, Helmstaedter M, Denk W. Wiring specificity in the direction-selectivity circuit of the retina. Nature. 2011;471:183–188. - PubMed
    1. Carandini M, Horton JC, Sincich LC. Thalamic filtering of retinal spike trains by postsynaptic summation. J Vis. 2007;7:20.1–11. - PMC - PubMed
    1. Chen C, Regehr WG. Developmental remodeling of the retinogeniculate synapse. Neuron. 2000;28:955–966. - PubMed
    1. Cleland BG, Dubin MW, Levick WR. Simultaneous recording of input and output of lateral geniculate neurones. Nature New Biol. 1971a;231:191–192. - PubMed
    1. Cleland BG, Dubin MW, Levick WR. Sustained and transient neurones in the cat’s retina and lateral geniculate nucleus. J Physiol (Lond) 1971b;217:473–496. - PMC - PubMed

Publication types

LinkOut - more resources