. 2012 Nov 21;76(4):776-89.
doi: 10.1016/j.neuron.2012.09.036.

Hippocampal pyramidal neurons comprise two distinct cell types that are countermodulated by metabotropic receptors

Affiliations

Hippocampal pyramidal neurons comprise two distinct cell types that are countermodulated by metabotropic receptors

Austin R Graves et al. Neuron. .

Abstract

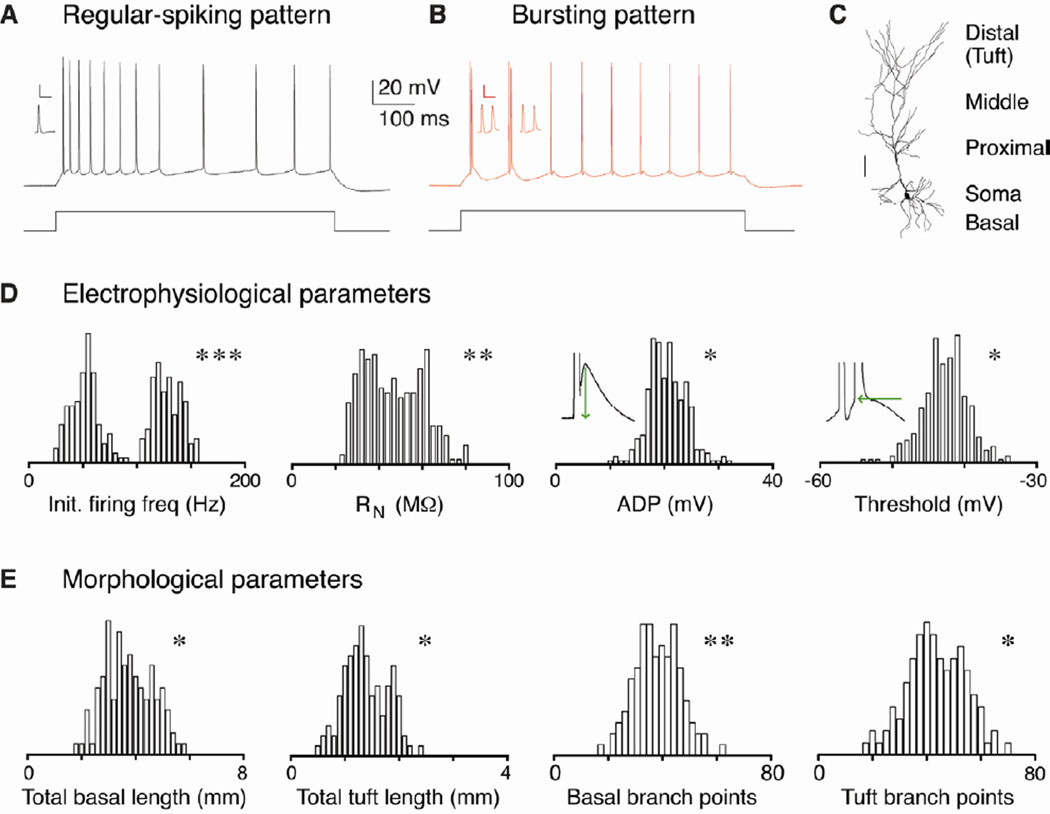
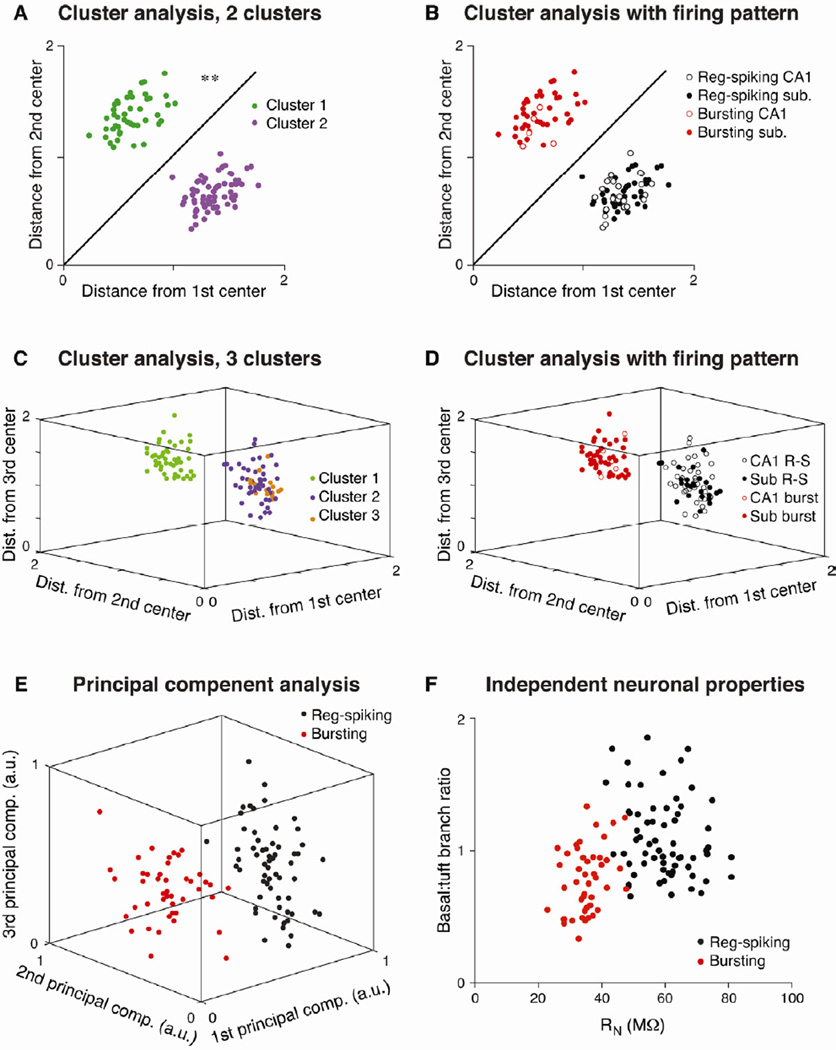
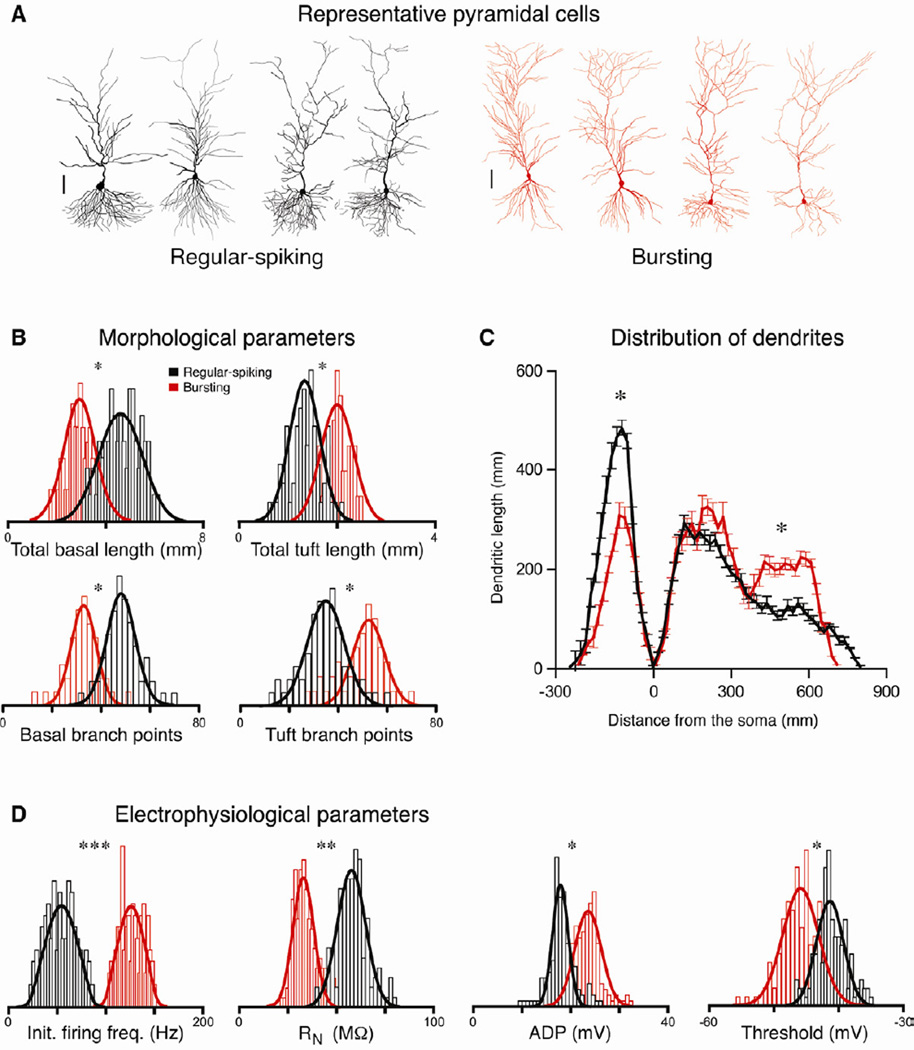
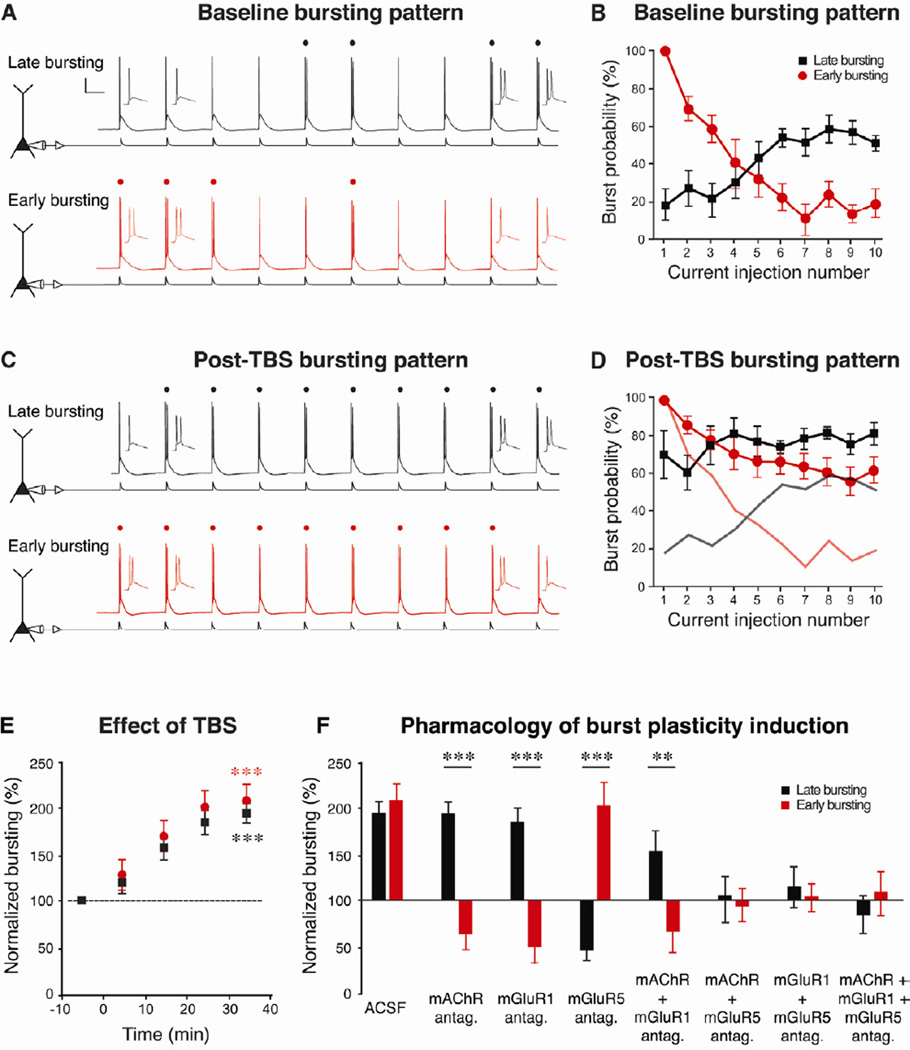
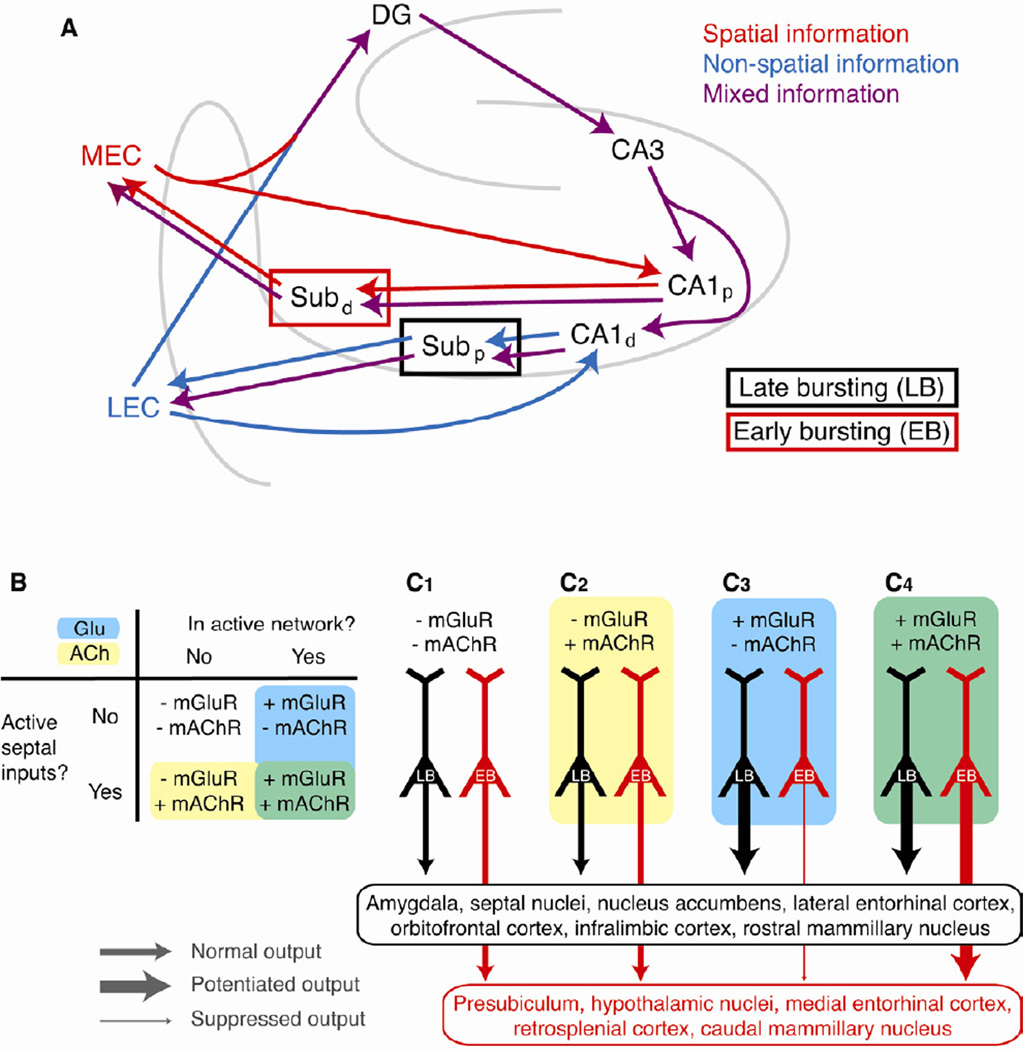
Relating the function of neuronal cell types to information processing and behavior is a central goal of neuroscience. In the hippocampus, pyramidal cells in CA1 and the subiculum process sensory and motor cues to form a cognitive map encoding spatial, contextual, and emotional information, which they transmit throughout the brain. Do these cells constitute a single class or are there multiple cell types with specialized functions? Using unbiased cluster analysis, we show that there are two morphologically and electrophysiologically distinct principal cell types that carry hippocampal output. We show further that these two cell types are inversely modulated by the synergistic action of glutamate and acetylcholine acting on metabotropic receptors that are central to hippocampal function. Combined with prior connectivity studies, our results support a model of hippocampal processing in which the two pyramidal cell types are predominantly segregated into two parallel pathways that process distinct modalities of information.


Figures

Figure 1
Figure 1. Distribution of electrophysiological and morphological properties
A-B. Pyramidal neurons in CA1 and the subiculum respond to step current injection in vitro by firing action potentials in one of two distinct patterns: regular spiking or bursting. The former pattern consists of trains of individual action potentials, while the latter pattern begins with one or more bursts of high frequency (>100 Hz) spikes. Inset: enlarged bursts (scale bar = 50 mV and 20 ms). C. Filled pyramidal neurons with different dendritic compartments indicated (scale bar = 100 µm). D-E. All-point histograms of the distributions of several electrophysiological (n = 268 cells) and morphological properties (n = 110 cells). Illustrations of how ADP and second spike threshold were measured are inset. P values from the D’Agostino & Pearson omnibus normality test demonstrate that the properties presented are not unimodally distributed, suggesting that there are discrete groups of pyramidal cells within this population. Asterisks indicate significant differences between the groups (*p < 0.05, ** p < 0.01, *** p < 0.001).
Figure 2
Figure 2. Two distinct classes of hippocampal pyramidal neurons
K-means cluster analysis assigns neurons to k groups based on the Euclidian distance of all parameters from the center of each of the k clusters (n = 110 cells). A. Plot of total distance from the center of two clusters (based on 15 electrophysiological and morphological parameters) reveals significant separation into two groups. Parameters directly related to bursting (e.g., spike frequency) were excluded from the cluster analysis. B. These two groups of cells align perfectly with the regular-spiking and bursting patterns, as every cell in the purple cluster displayed regular spiking and every cell in the green cluster displayed bursting. C. Distribution of cells into three clusters. Note the lack of separation between the orange and purple clusters (2 and 3), while the green cluster (1) is significantly separated from both. D. Similarly, when all cells are grouped into 3 clusters, separation is only apparent between regular-spiking and bursting neurons. E. A principal component analysis was performed on the same 15 electrophysiological and morphological properties, and a plot of the first three principal components shows complete separation between regular-spiking and bursting neurons. F. Qualitatively similar (but incomplete) separation between regular-spiking and bursting neurons is observed by plotting two independent parameters: input resistance and the ratio of basal to tuft dendritic branch points. Asterisks indicate significant differences between the groups (** p < 0.01).
Figure 3
Figure 3. Morphological and physiological differences between pyramidal cell types
A. Representative reconstructions of regular-spiking (black) and bursting (red) neurons (scale bar = 100 µm). B. Histograms of the distribution of several morphological properties (n = 110 cells) and Gaussian fits of regular-spiking (black) and bursting (red) neurons. C. Distribution of dendrites by region. Plot is dendritic length as a function of distance from the soma in 20 µm segments. Negative distance denotes basal dendritic length; positive distance denotes apical length. Note that regular-spiking neurons have longer, more extensively branched basal dendrites, whereas bursting neurons have longer, more extensively branched tuft dendrites (those in the most distal third of the apical tree). There are no differences in the total dendritic length in the proximal and middle thirds of the apical dendritic tree. D. Histograms of the distribution of several electrophysiological (n = 268) properties for the two cell types. Asterisks indicate significant differences between the groups (*p < 0.05, ** p < 0.01, *** p < 0.001).
Figure 4
Figure 4. Metabotropic receptors countermodulate intrinsic excitability
A. In response to trains of repeated brief current injections, both types of neurons generated bursts (denoted by dots) and single spikes, though with different temporal patterns. Late-bursting neurons (black, previously called “regular-spiking”) displayed single spikes early in the train and bursts later, while early-bursting neurons (red, previously called “bursting”) displayed bursts early and single spikes late. B. Late-bursting neurons (black squares) showed development of bursting with repeated inputs, whereas early-bursting neurons (red circles) showed inactivation of bursting with repeated inputs. C-E. Theta-burst synaptic stimulation (TBS) increased the number of bursts evoked by the same amplitude somatic current injection (in representative traces from both cell types, 4 bursts were evoked during baseline (A) and 9 were evoked after TBS (C), indicating the induction of burst plasticity). Faded black and red lines (in D) depict the pre-TBS bursting patterns of the two types of neurons (from B). F. Normalized values for bursting (average number of bursts during 30–40 minutes after TBS, divided by the average number of bursts during the 10 minute pre-TBS baseline period) in the two cell types under a variety of pharmacological conditions (mAChRs antagonist: 10 µM atropine, mGluR1 antagonist: 25 µM LY367385, mGluR5 antagonist: 10 µM MPEP; all drugs were bath applied for the entire experiment). Asterisks indicate significant differences between the groups ** p < 0.01, *** p < 0.001). Note the opposing effects of blocking metabotropic receptors, indicating countermodulation of the two cell types.
Figure 5
Figure 5. Burst plasticity does not convert late-bursting cells to early-bursting
A-C. Burst plasticity is graded and can be saturated. Representative voltage responses (top) to a train of 30, 5 Hz somatic current injections (bottom) from a late-bursting neuron at baseline (A), following 2X TBS in normal ACSF (B), and following 5X TBS (C). Bursts are denoted by dots and the scale bars represents 20 mV and 100 ms. D. In late-bursting CA1 neurons, repeated synaptic TBS epochs in normal ACSF significantly enhanced bursting to saturating levels (n = 6). E. Once enhanced bursting was saturated, MPEP (10 µm, mGluR5 antagonist) was bath applied for 10 minutes, and a final synaptic TBS epoch was delivered. Under these pharmacological conditions (green line), bursting was significantly decreased compared to experiments where MPEP was washed on but a final induction stimulus was not delivered (n = 6, *p < 0.05).
Figure 6
Figure 6. Countermodulation of parallel output streams from the hippocampus
A. Separate classes of pyramidal cells preferentially connect different hippocampal inputs and outputs. Inputs from the medial entorhinal cortex (MEC) contain predominantly spatial information (red), whereas inputs from lateral entorhinal cortex (LEC) contain predominantly non-spatial information (blue). In the indirect path to CA1 through the “trisynaptic loop,” these distinct modalities of information are merged within a single information stream (purple) in the dentate gyrus. In the direct path from the EC to CA1, these biased inputs target largely separate areas of CA1, which in turn project to separate regions of subiculum that contain different proportions of the two cell types. Thus, spatial information is processed predominantly by early-bursting cells in the distal subiculum (red box) and non-spatial information is processed predominantly by late-bursting cells in the proximal subiculum (black box). Finally, late-bursting and early bursting cells in subiculum project predominantly to non-spatial (LEC) and spatial (MEC) regions of entorhinal cortex, respectively, thus forming two closed loops for processing these distinct modalities of information. Note that while projections from the two cell types are depicted as absolute, the magnitude of this preference is approximately four-fold (e.g., ~80% of the hippocampal output to LEC is carried by late-bursting cells and ~20% is carried by early-bursting cells). B-C. Neuromodulatory input from the active hippocampal network (via activation of mGluRs) and cholinergic input from the septal nuclei (via activation of mAChRs) have differential effects on the intrinsic excitability and action potential output from late-bursting and early-bursting cells. C1. In the absence of any neuromodulatory input, output from both pyramidal cell types is not modulated (medium thickness lines). C2. Similarly, cholinergic input to a cell that is not in the active hippocampal network (i.e., no mGluR activation) does not modulate excitability. C3. Glutamatergic input alone activates mGluR5, consequently enhancing output from late-bursting neurons (thick black line) and suppressing output from early-bursting neurons (thin red line). This is the countermodulation condition. C4. When mAChRs and mGluRs are activated by concurrent glutamatergic and cholinergic input, output from both types is enhanced (thick lines), with upregulation of early-bursting cells reflecting synergistic activation of mGluR1 and mAChR. Late-bursting and early-bursting cells in subiculum project predominantly to different groups of neuronal targets. Thus, depending on the specific subtypes of metabotropic receptors that are activated, hippocampal output can be bidirectionally modulated to different sets of efferent targets throughout the brain that receive preferential input from one cell type.

References

    1. Amaral DG, Witter MP. The three-dimensional organization of the hippocampal formation: a review of anatomical data. Neuroscience. 1989;31:571–591. - PubMed
    1. Babadi B. Bursting as an effective relay mode in a minimal thalamic model. J Comput Neurosci. 2005;18:229–243. - PubMed
    1. Bear MF, Huber KM, Warren ST. The mGluR theory of fragile X mental retardation. Trends Neurosci. 2004;27:370–377. - PubMed
    1. Beurrier C, Congar P, Bioulac B, Hammond C. Subthalamic nucleus neurons switch from single-spike activity to burst-firing mode. J Neurosci. 1999;19:599–609. - PMC - PubMed
    1. Dembrow NC, Chitwood RA, Johnston D. Projection-specific neuromodulation of medial prefrontal cortex neurons. J Neurosci. 2010;30:16922–16937. - PMC - PubMed

Publication types

MeSH terms