. 2013 Jan 4;46(1):151-7.
doi: 10.1016/j.jbiomech.2012.10.034. Epub 2012 Nov 21.

A phenomenological muscle model to assess history dependent effects in human movement

Affiliations

A phenomenological muscle model to assess history dependent effects in human movement

C P McGowan et al. J Biomech. .

Abstract

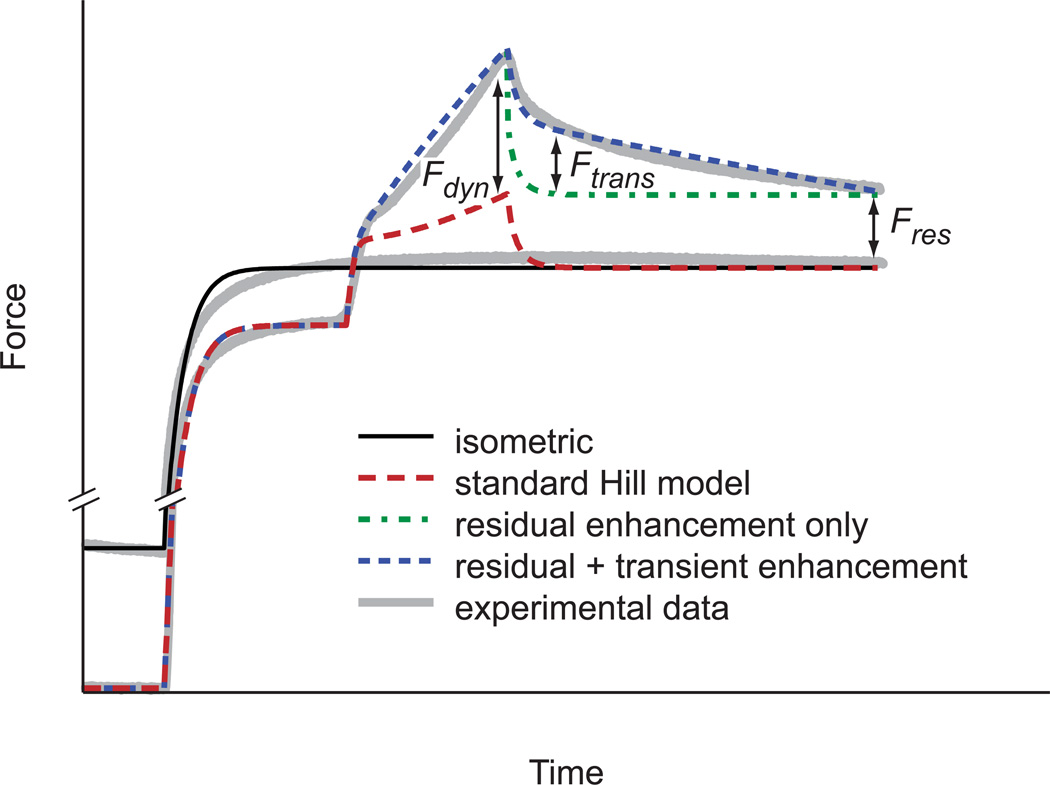
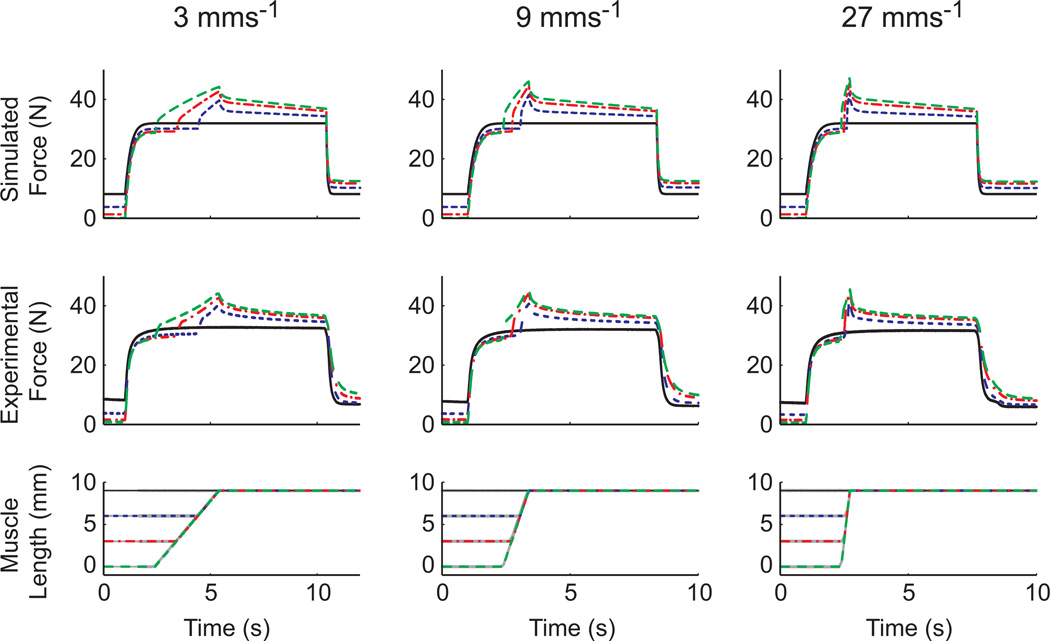
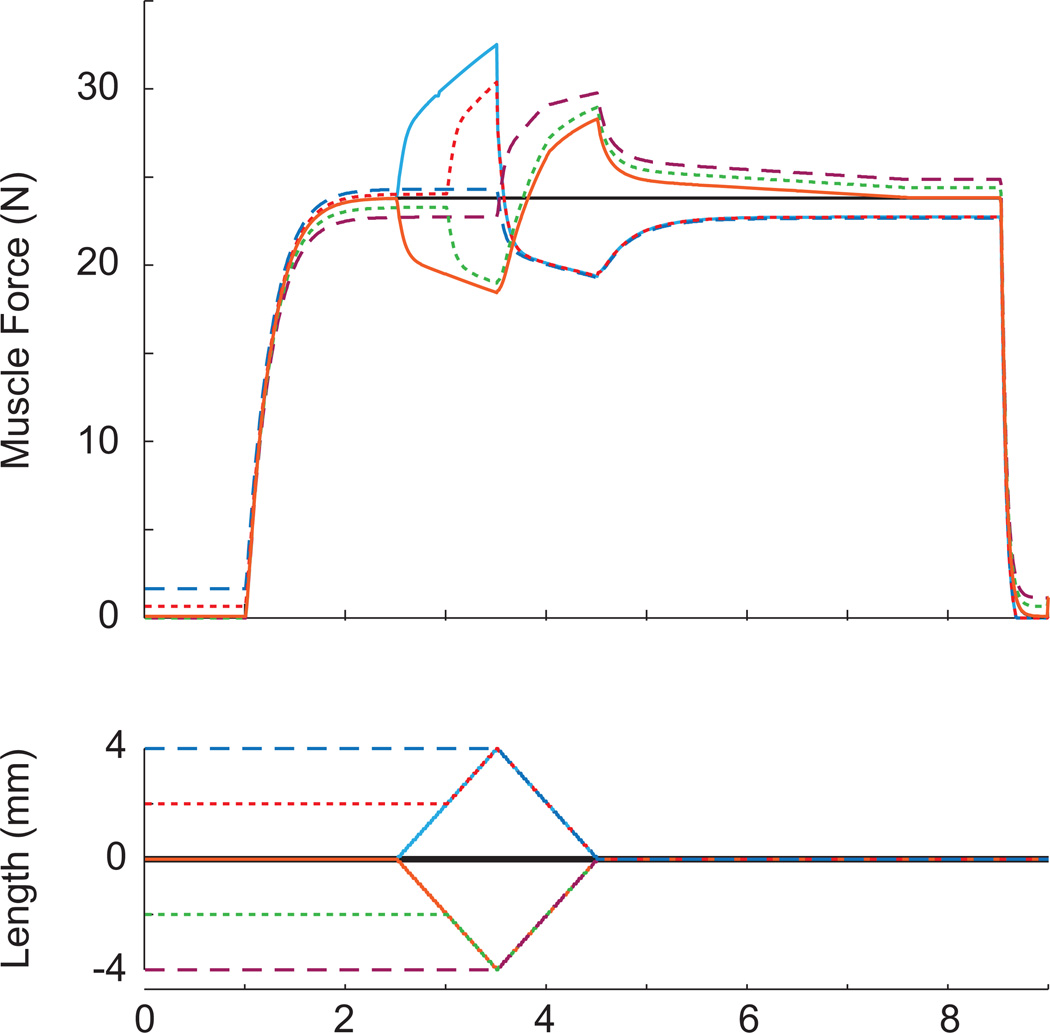
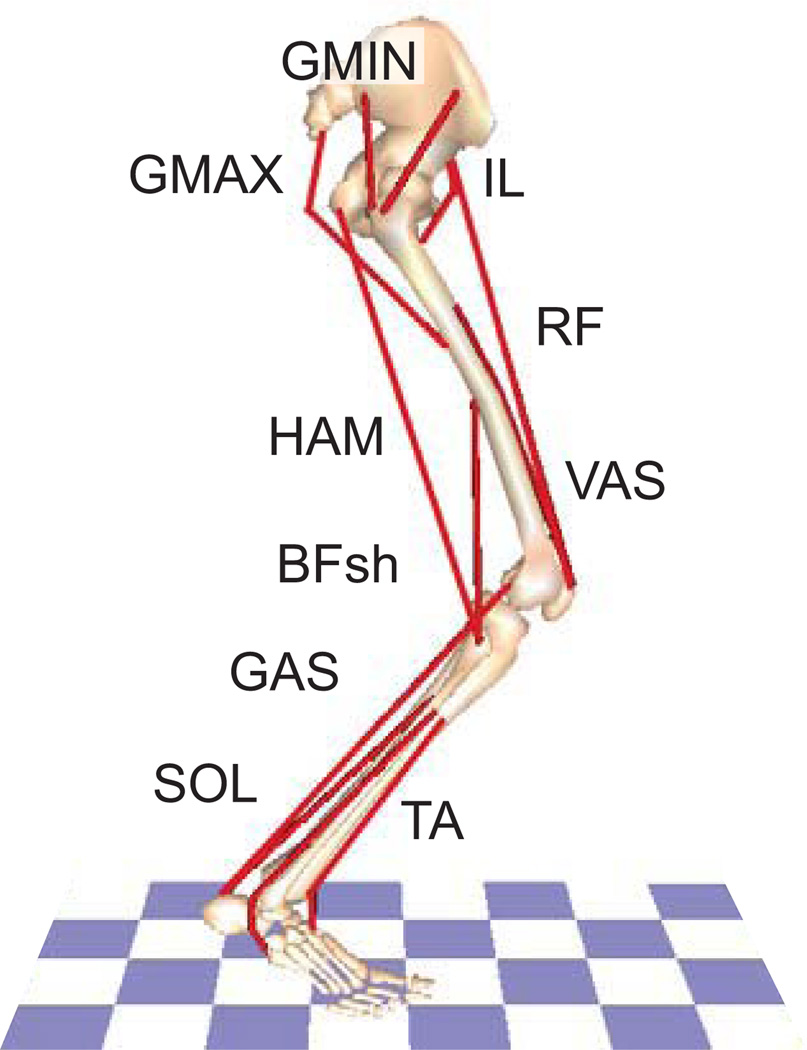
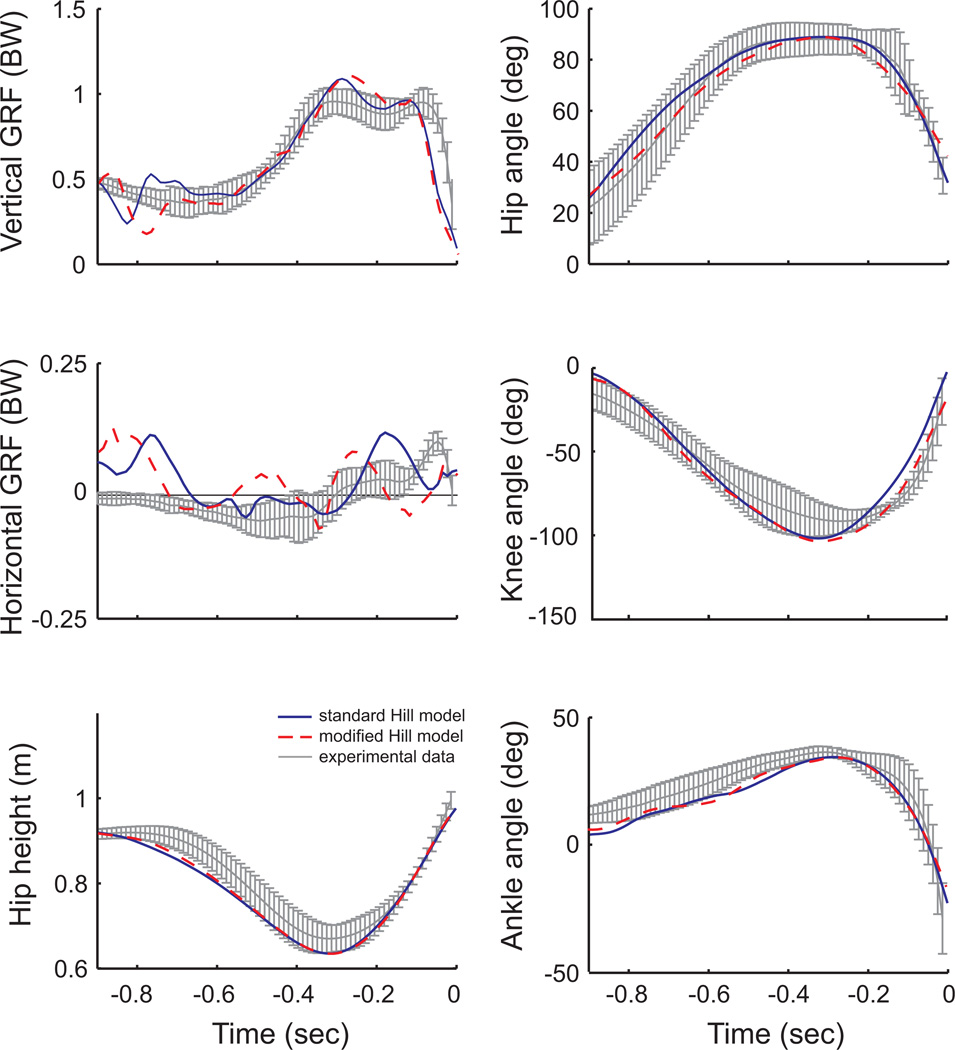
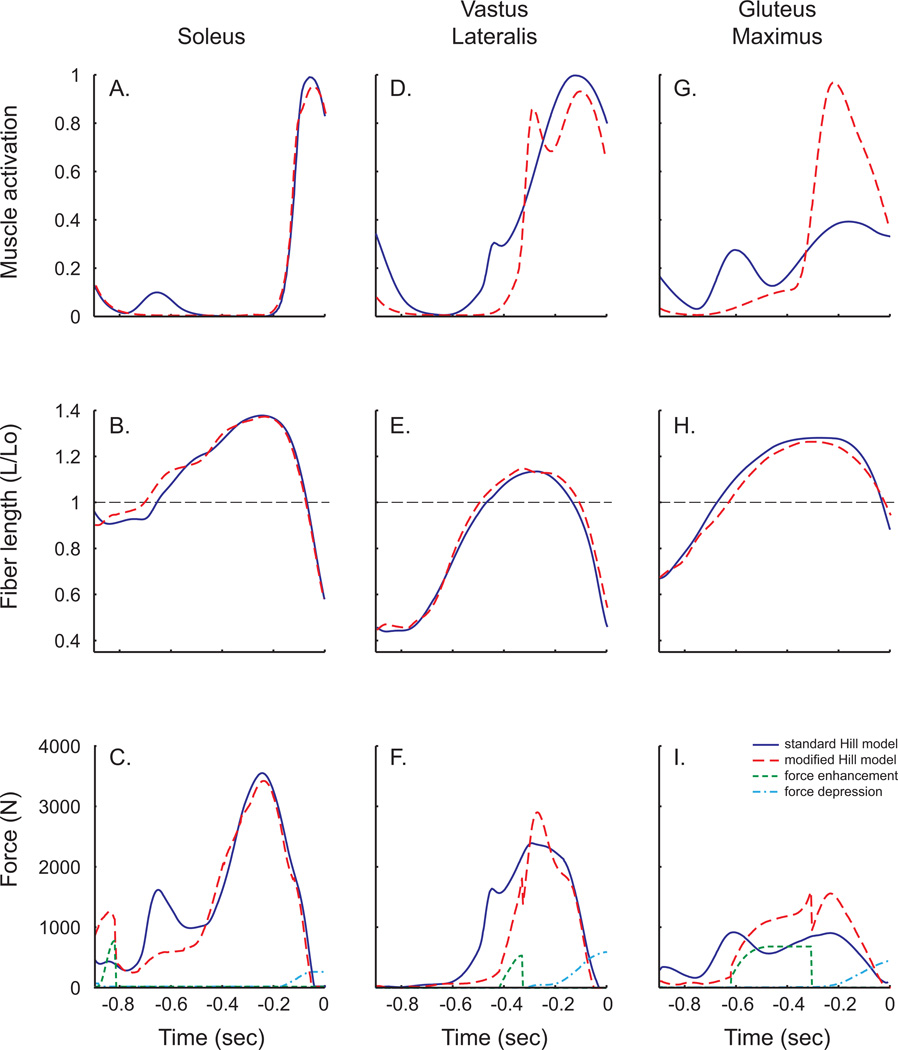
Most musculoskeletal models used to analyze human movement utilize Hill-type muscle models that account for state dependent intrinsic muscle properties (e.g., force-length-velocity relationships), but rarely do these models include history dependent effects (e.g., force depression or enhancement). While the relationship between muscle shortening and force depression can be well characterized by muscle mechanical work, the relationship between muscle stretch and force enhancement is more complex. Further, it is not well known how these properties influence dynamic movements. Therefore, the goal of this study was to develop a modified Hill-type muscle model that incorporated stretch-induced force enhancement into a previously described model that included shortening-induced force depression. The modified muscle model was based on experimental data from isolated cat soleus muscles. Simulations of in situ muscle experiments were used to validate the model and simulations of a simple human movement task (counter-movement jumping) were used to examine the interactions of the history dependent effects. The phenomenological model of stretch-induced force enhancement was dependent on both the magnitude of stretch and relative length of the muscle fiber. Simulations of the in situ muscle experiments showed that the model could accurately reproduce force enhancement and force depression, as well as the complex additive relationship between these effects. Simulations of counter-movement jumping showed that a similar jump pattern could be achieved with and without history dependent effects and that a relatively minor change in muscle activation could mitigate the impact of these effects.


Conflict of interest statement

Conflict of Interest Statement

The authors have no conflict of interest.

Figures

Figure 1
Figure 1
A schematic showing the components of the history dependent stretch force enhancement model. The model including residual force enhancement (Fres), transient force enhancement (Ftrans) and dynamic force enhancement (Fdyn) provides the best match with experimental data. For comparison, the force produced by a classic Hill-type model undergoing the same active stretch is shown.
Figure 2
Figure 2
A comparison of simulated and experimental in situ active stretch force data. Muscles were stretched over three different lengths (3, 6, and 9 mm) at three different speeds (3, 9 and 27 mm s−1). The simulated force outputs (top row) agreed well with experimental force data (middle row) in all conditions. The individual colors and patterns within each column correspond to a given trial. The experimental data are average data from cat soleus muscles taken from Leonard and Herzog (2002).
Figure 3
Figure 3
Simulated force data from the modified muscle model for active stretch-shorten and shorten-stretch cycles. Stretch-shorten cycles consisted of 4mm contractions preceded by active stretches of 0mm, 2mm and 4mm. Shorten-stretch cycles consisted of 4mm stretches preceded by contractions of 0mm, 2mm and 4mm. All length changes occurred at 4mm/s and ended at the muscle’s optimal length. The modified muscle model includes both stretch induced force enhancement and shortening induced force depression. Colors and line patterns are the same for muscle force and length for each condition. Consistent with experimental data, history dependent effects are cumulative during shorten-stretch cycles but not during stretch-shorten cycles.
Figure 4
Figure 4
The musculoskeletal model for simulations of countermovement jumping (right side shown) consisted of rigid segments representing the trunk and two legs, with each leg consisting of a thigh, shank, patella, and three-part foot for a total of 13 degrees of freedom (flexion/extension at the hip, knee, ankle, mid foot and toes of each leg along with vertical and horizontal translation and rotation of the trunk). The model was driven by 25 musculotendon actuators per leg grouped into 13 muscle groups based on anatomical function: IL (illiacus, psoas), GMAX (gluteus maximus, adductor magnus), GMED (anterior and posterior regions of the gluteus medius), VAS (3-component vastus), RF (rectus femoris), HAM (medial hamstrings, biceps femoris long head), BFsh (biceps femoris short head), GAS (medial and lateral gastrocnemius), SOL (soleus, tibialis posterior), TA (tibialis anterior, peroneus tertius), PR (peroneus longus, peroneus brevis), FLXDG (flexor digitorum longus, flexor hallucis longus) and EXTDG (extensor digitorum longus, extensor hallucis longus). PR, FLXDG, and EXTDG are not shown. Each muscle within a group received the same excitation pattern.
Figure 5
Figure 5
Ground reaction force and kinematic data from the counter movement jump. The gray lines are the average experimental data (± 2 standard deviations) from 10 jumping trials from a single subject. The solid blue lines are data from the control simulation and the dashed red lines are data from simulation with the modified muscle model.
Figure 6
Figure 6
Simulated muscle data for the soleus, vastus lateralis and gluteus maximus from the control simulation (solid lines) and simulation with the modified muscle model (dashed lines). Muscle activation patterns (top row) were allowed to vary between the two simulations. Slight differences in kinematics produced small differences in muscle length change (middle row). The magnitude of force generated by muscles with the modified muscle model included both stretch-induced force enhancement and shortening-induced force depression.

References

    1. Abbott BC, Aubert XM. The force exerted by active striated muscle during and after change of length. J Physiol. 1952;117:77–86. - PMC - PubMed
    1. Bullimore SR, Leonard TR, Rassier DE, Herzog W. History dependence of isometric muscle force: effect of prior stretch or shortening amplitude. J Biomech. 2007;40:1518–1524. - PubMed
    1. Edman KA. Mechanical deactivation induced by active shortening in isolated muscle fibres of the frog. J Physiol. 1975;246:255–275. - PMC - PubMed
    1. Edman KA, Elzinga G, Noble MI. Enhancement of mechanical performance by stretch during tetanic contractions of vertebrate skeletal muscle fibres. J Physiol. 1978;281:139–155. - PMC - PubMed
    1. Edman KA, Elzinga G, Noble MI. Residual force enhancement after stretch of contracting frog single muscle fibers. J Gen Physiol. 1982;80:769–784. - PMC - PubMed

Publication types