. 2012 Nov 21;151(5):1029-41.
doi: 10.1016/j.cell.2012.10.038.

Three-dimensional architecture of the rod sensory cilium and its disruption in retinal neurodegeneration

Affiliations

Three-dimensional architecture of the rod sensory cilium and its disruption in retinal neurodegeneration

Jared C Gilliam et al. Cell. .

Abstract

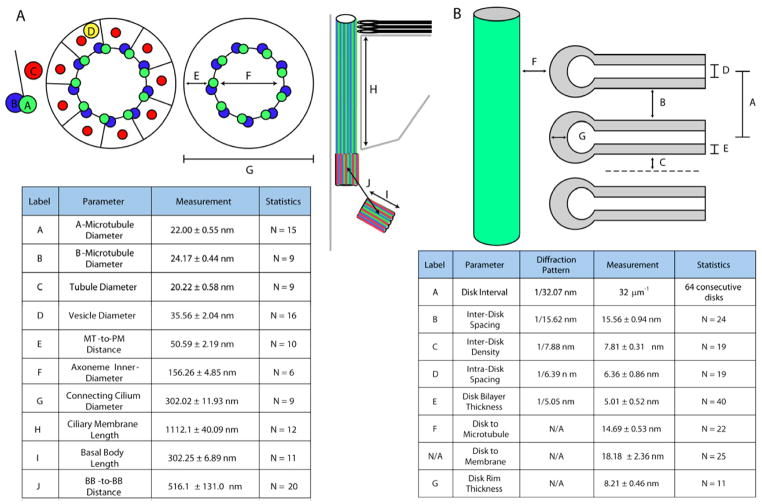
Defects in primary cilia lead to devastating disease because of their roles in sensation and developmental signaling but much is unknown about ciliary structure and mechanisms of their formation and maintenance. We used cryo-electron tomography to obtain 3D maps of the connecting cilium and adjacent cellular structures of a modified primary cilium, the rod outer segment, from wild-type and genetically defective mice. The results reveal the molecular architecture of the cilium and provide insights into protein functions. They suggest that the ciliary rootlet is involved in cellular transport and stabilizes the axoneme. A defect in the BBSome membrane coat caused defects in vesicle targeting near the base of the cilium. Loss of the proteins encoded by the Cngb1 gene disrupted links between the disk and plasma membranes. The structures of the outer segment membranes support a model for disk morphogenesis in which basal disks are enveloped by the plasma membrane.


Figures

Figure 1
Figure 1. Cilium-Associated Structures in the Rod IS
(A) Diagram of rod cell and regions adjacent to the connecting cilium. (B) Immunofluorescence of isolated rod OS/IS preparation stained with antibodies specific for rhodopsin (red) and rootletin (green). Bar = 5 μm (C) Projection (6 nm thick) from a tomogram of the IS ellipsoid region and adjacent structures of the connecting cilium (CC), basal bodies (BB), and rootlet (R). Bars in (C–D) = 0.1 μm. (D) Segmented version of tomogram shown in (C). Microtubules (light blue, A MT; green, B MT; red, C MT), axoneme filaments/transition fibers (pink), rootlet (brown), plasma membrane (gray), endoplasmic reticulum (dark blue), mitochondria (magenta), ribosomes (yellow). (E) Conventional EM image of stained ultrathin section of mouse retina showing a typically striated ciliary rootlet terminating near the proximal basal body. Bar = 0.2 μm. (F) Tomogram Projection of a ciliary rootlet. Bars in (F–G) = 0.1 μm. (G) Segmented version of (F), showing rootlet, striations (arrowheads in (F), orange/yellow in (G) and (I)), filaments (green), and non-vesicle rootlet-associated particles (blue). (H and I) Enlarged region of tomogram with rootlet-attached particle, segmented in (I). Bars = 50 nm. (J and K) Tomogram and segmentation of microtubule with attached vesicle. Bars = 50 nm. (L and M) Axial density profiles of particle (L) and vesicle (M) taken from (H) and (J). (N and O) Histograms of rootlet-associated particle diameters measured in rods from (N) dark- and (O) light-adapted retinas. N = total particles per condition. (See also Figure S1 and Movie S1)
Figure 2
Figure 2. Structures of the Distal IS
(A) Tomogram projection of wildtype basal bodies. Cross-section slices (red lines) through the distal (A1) and proximal (A2) basal bodies along the z-axis (proximal-to-distal direction indicated by black arrows) show opposite rotation polarity of microtubule triplets, as indicated in the diagrams [right]. All bars = 0.1 μm. (B and C) Tomogram projection and segmentation of basal bodies, rootlet fibers, and non-vesicle particles from the wildtype rod IS. Microtubules (green, blue, red), rootlet filaments (brown), and rootlet particles (blue). (D–F) Multiple projections shown as raw data [top] or annotated [bottom] by segmentation. D and F are from the cell in (A). (D) Transition fibers (red) originate from [outermost] C-microtubules of basal body triplets and extend horizontally to the plasma membrane where vesicles (yellow) are located. (E) Vesicles (yellow) are tethered to the plasma membrane by filamentous proteins (blue). (F) Panel of three consecutive tomographic slices. From C-microtubules extend distal appendages (green) that extend both radially to neighboring microtubules and distally into the cilium. Filaments originating from the IS (red) interact with vesicles (yellow), C-microtubule distal appendages (green), and ciliary membrane filaments (blue). (G) Segmentation from (F) of vesicles (yellow), IS filaments (red), distal appendages (green), and membrane tethers (blue) in the pericentriolar region. (H) Tomogram projection through the axoneme basal body shows 80 nm long rootlet filaments (black box) extending into axoneme center. All bars = 0.1 μm. (I) Magnification of bounded area from (H) shows multiple filament densities. (J) Density profile of the filament (indicated by red line in (I)). (See also Figure S2 and Movie S2)
Figure 3
Figure 3. Structures of the Connecting Cilium
(A) Conventional EM image of the CC from stained rods. All bars = 0.1 μm. (B and C) Tomogram and segmentation of the wildtype CC reveal low-contrast particles (arrowheads in (B)) bounded by microtubules in the central axoneme compartment. CC membrane (gray), and particles (cyan). (D) Tomogram projections through the wildtype CC in the X–Y plane [top] and X–Z plane cross-section [bottom] resolve 20 nm tubules extending the length of the CC, parallel to the axoneme. Tubule is limited to the outer-axonemal space (arrowheads). (E) Tomogram projection of CC cross-section showing 20 nm tubules [white arrowheads] parallel to axoneme microtubules. One vesicle is shown between the axoneme and the plasma membrane [black arrowhead]. (F) Segmentation from (E) of membrane (gray), microtubules (green, blue), particles (cyan), tubule (red), and vesicle (yellow) in the wildtype CC. (G and H) Tomogram and segmentation overlay of filaments (red) anchoring disk rim (white) at the OS base to axoneme microtubules of the CC. (I) Segmentation of filaments from (B). (J and K) Tomogram and segmentation of low-contrast particle bound to actin-like filaments in the CC just below the region of nascent OS disk formation. Microtubules (green, blue), actin (red), and particle (cyan). (See also Figure S3 and Movie S3)
Figure 4
Figure 4. Structures Associated with the Ciliary Membrane
(A) Protein densities in the CC membrane. Bar = 0.1 μm. (B) Tomogram and segmentation of membrane densities (box in (A)). Membrane (gray), and proteins (blue). Bars = 50 nm. (C) Concanavalin A-ferritin labels rhodopsin N-termini in a tomogram projection through the CC. Stalk-like protrusions seen in (A) and (B) labeled with ferritin (arrowheads). Bar = 0.1 μm. (D) Tomogram of the CC membrane surface with rhodopsin labeled with concanavalin A-ferritin. (E) Histogram of rhodopsin-ferritin distribution within the ciliary membrane. A 0.27 μm2 region of membrane was divided into 300 equal squares, and the number of ferritins in each counted (952 = total). The curve is the expectation for a random distribution (Clarke, 1946). (See also Figure S4 and Movie S4)
Figure 5
Figure 5. Structures of the Outer Segment
(A) Micrograph of a vitrified rod OS shows spacing of 32 disks per μm. Bar = 0.5 μm. (B) Cryo-ET preserves the native structural organization of rod OS. Nascent disk contained within the OS plasma membrane (arrowhead). Bar = 0.2 μm. (C) Conventional micrograph of a stained rod shows nascent disks contained within the OS plasma membrane (arrowhead). Bar = 0.4 μm. (D and E) Tomogram and segmentation of wildtype OS disk stack. Bar = 0.1 μm. (F) Fourier transform (computed diffraction pattern) from dashed box in (D) indicates up to 6 intensity maxima in reciprocal space [top]. Analysis performed on tomogram with 1.7 nm/pixel resolution. The highest resolution obtained (1/5.05 nm) corresponds to the bilayer thickness of the OS disk [bottom]. Bar = 15 nm. (G) Frequency spectrum of maxima in (F) confirms 6 discrete peaks are present in the data. (See also Figure S5)
Figure 6
Figure 6. Quantitative Summary of Structural Features
Measurements of the CC (A) and the OS (B) features. Direct measurements are provided as mean ± standard deviation. N, = total measurements collected per parameter.
Figure 7
Figure 7. Structural Perturbations Caused By Genetic Defects
(A and B) Tomogram projections from wildtype (A) and Crocc−/− (B) cilia. Bars (A–C′) = 0.2 μm. (C and C′) Structural differences in Crocc−/− cilia lead to fragile axonemes. Segmentation of basal bodies and filaments from (B). Microtubules (green, blue, red), interconnecting filaments (orange), plasma membrane (gray), organelle (likely ER and mitochondria) membranes (magenta, blue), ribosomes (yellow), and disrupted OS disks (yellow, left side and upper right corner). (D) Histogram of broken axonemes in tomograms from wildtype and Crocc−/− cilia. N = number of tomograms for each genotype. Error bars represent Poisson statistics for N. (E) Projection (~30 nm thick) of wildtype [top] and Crocc−/− [bottom] cilia. Bar = 0.1 μm. (F) Altered axial ratios from Crocc−/− cilia indicate structural defects in mutant axonemes. N = number of axonemes measured for each genotype. Data are mean ± standard deviation. (G) Tomogram of the OS from a Bbs4−/− rod shows altered disk orientation and morphology (arrowhead). Bar = 0.4 μm. (H and I) Tomogram and segmentation of the Bbs4−/− CC reveals vesicles accumulated along the axoneme. Microtubules (green, blue, red), plasma membrane (gray), and vesicles (yellow, pink). Bar = 50 nm. (J and K) Tomogram and segmentation of the Cngb1−/− rod indicates disrupted OS membrane structure resulting from aberrant growth of OS disks. Microtubules (green, blue), plasma membrane (gray), and OS disks (yellow, gold). Bar = 0.2 μm. (L) Tomogram projection of the Cngb1−/− OS shows excessive disk growth is caused by lack of contact between the plasma membrane (PM) and disk rims. (M) Fourier transform from dashed box in (L) yields three intensity maxima, indicating normal disk spacing in Cngb1−/− OS. Bar = 0.2 μm. (N) Diagram of perturbations found in Crocc−/− rod cells. (O) Diagram of perturbations found in Bbs4−/− rod cells (P) Diagram of perturbations found in Cngb1−/− rod cells (See also Figure S6)

References

    1. Abd-El-Barr MM, Sykoudis K, Andrabi S, Eichers ER, Pennesi ME, Tan PL, Wilson JH, Katsanis N, Lupski JR, Wu SM. Impaired photoreceptor protein transport and synaptic transmission in a mouse model of Bardet-Biedl syndrome. Vision Res. 2007;47:3394–3407. - PMC - PubMed
    1. Abramoff MD, Magelhaes PJ, Ram SJ. Image Processing with ImageJ. Biophotonics International. 2004;11:36–42.
    1. Adams NA, Awadein A, Toma HS. The retinal ciliopathies. Ophthalmic Genet. 2007;28:113–125. - PubMed
    1. Anderson RG. The three-dimensional structure of the basal body from the rhesus monkey oviduct. J Cell Biol. 1972;54:246–265. - PMC - PubMed
    1. Ardell MD, Bedsole DL, Schoborg RV, Pittler SJ. Genomic organization of the human rod photoreceptor cGMP-gated cation channel beta-subunit gene. Gene. 2000;245:311–318. - PubMed

Publication types

MeSH terms