. 2012 Nov 21;151(5):1097-112.
doi: 10.1016/j.cell.2012.10.043.

Microcephaly gene links trithorax and REST/NRSF to control neural stem cell proliferation and differentiation

Affiliations

Microcephaly gene links trithorax and REST/NRSF to control neural stem cell proliferation and differentiation

Yawei J Yang et al. Cell. .

Abstract

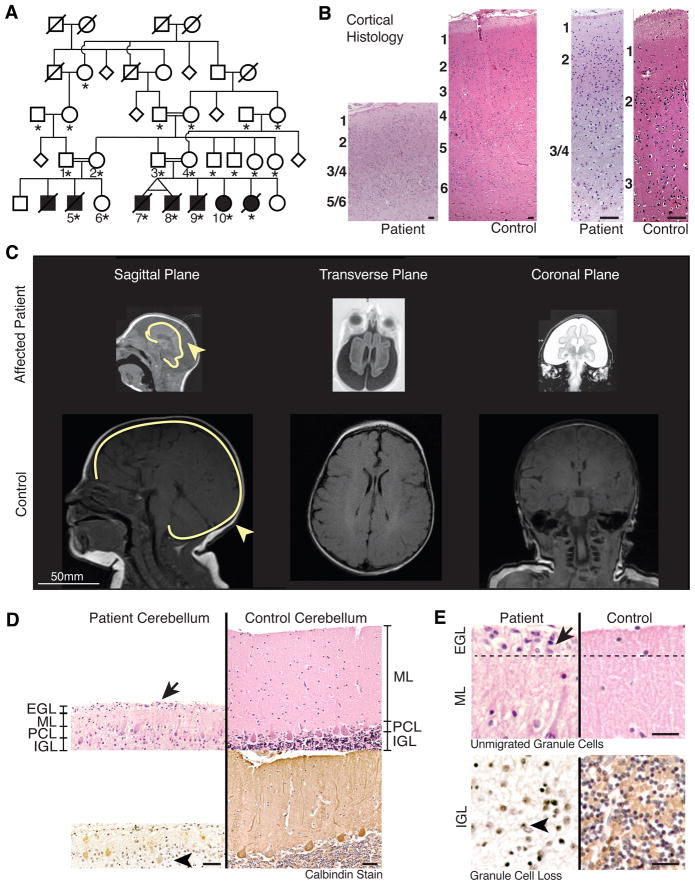
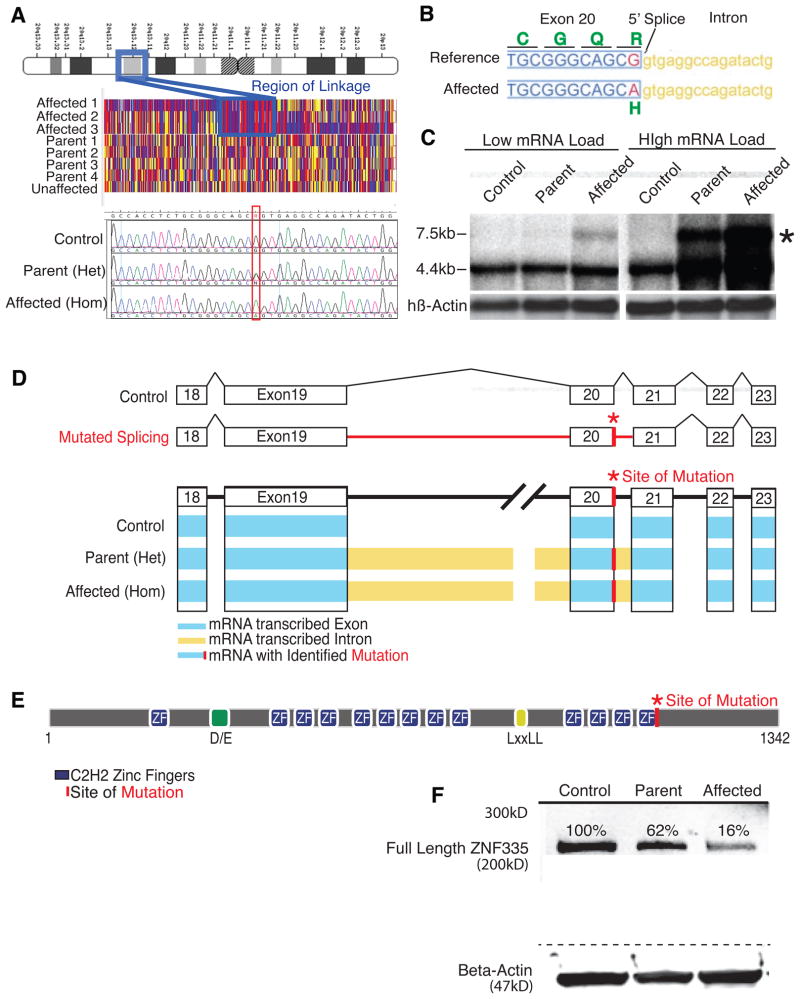
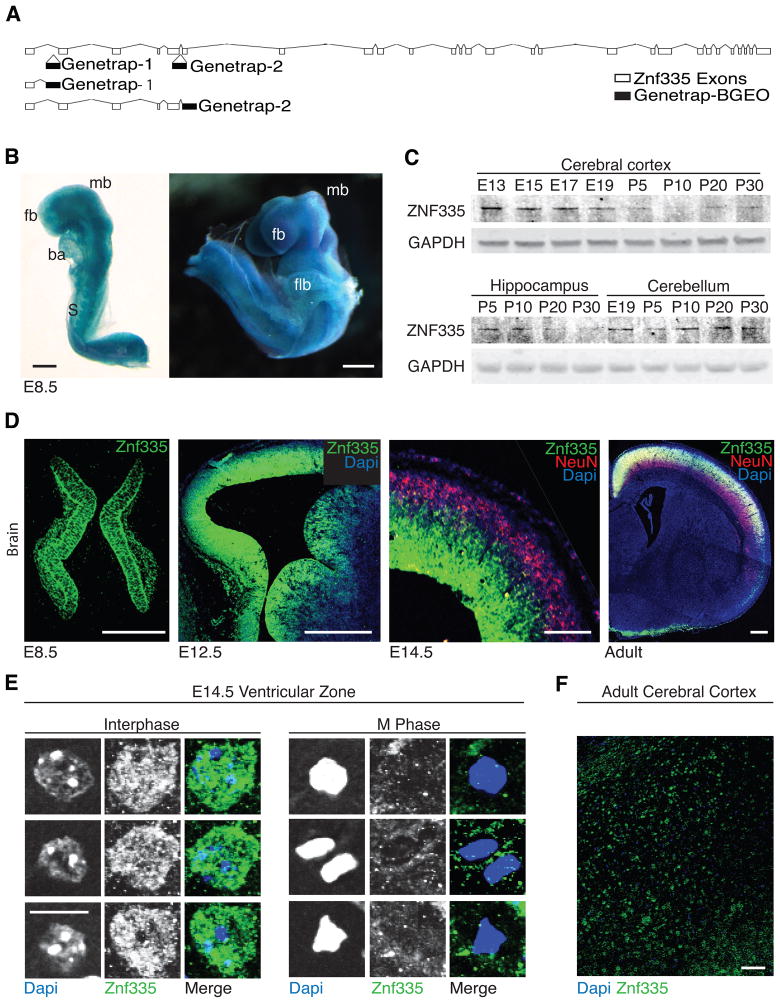
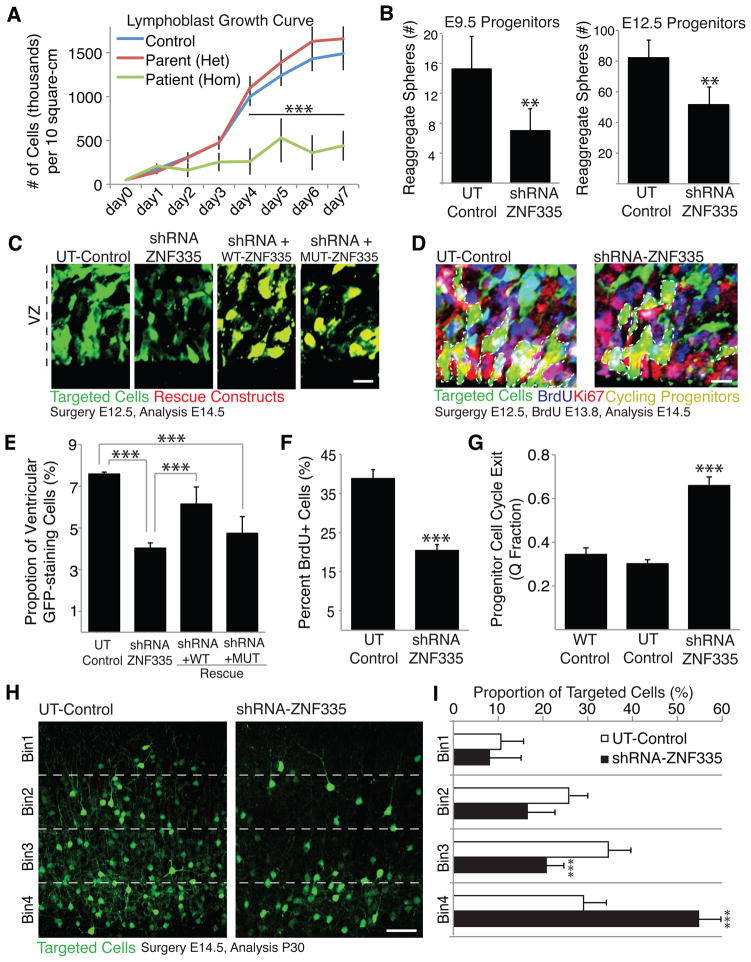
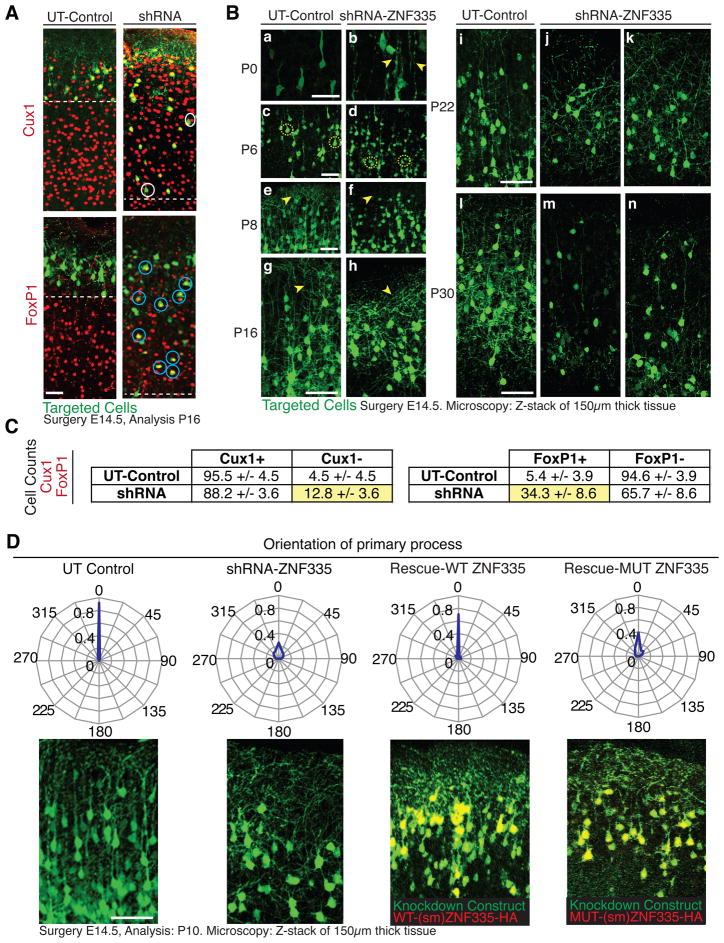
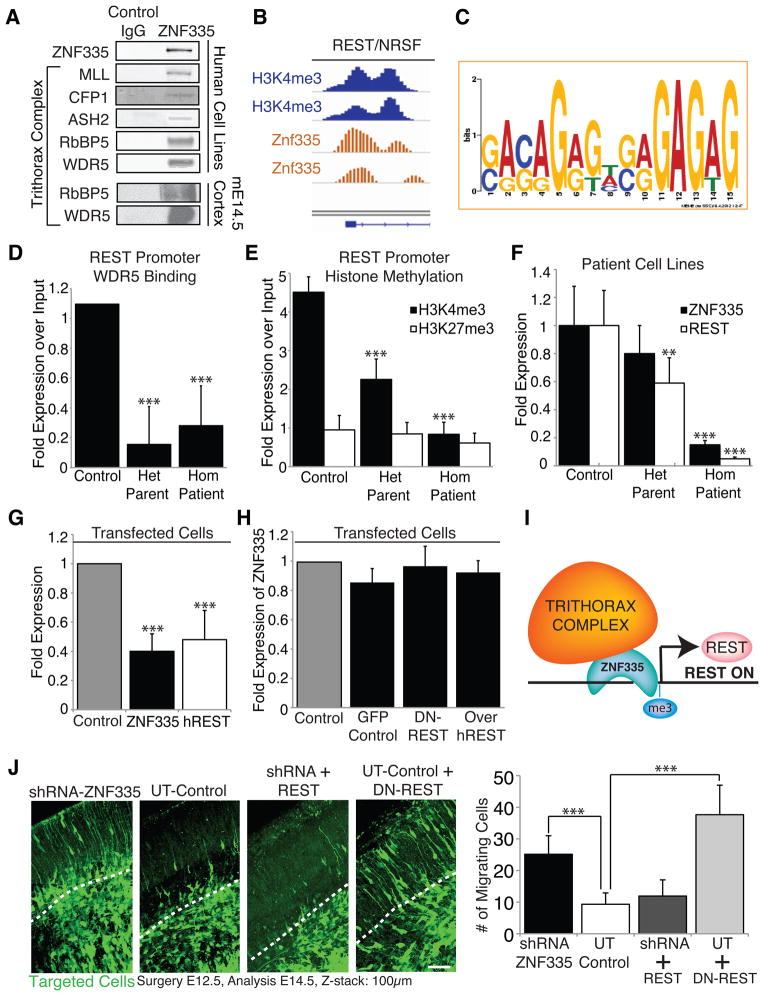
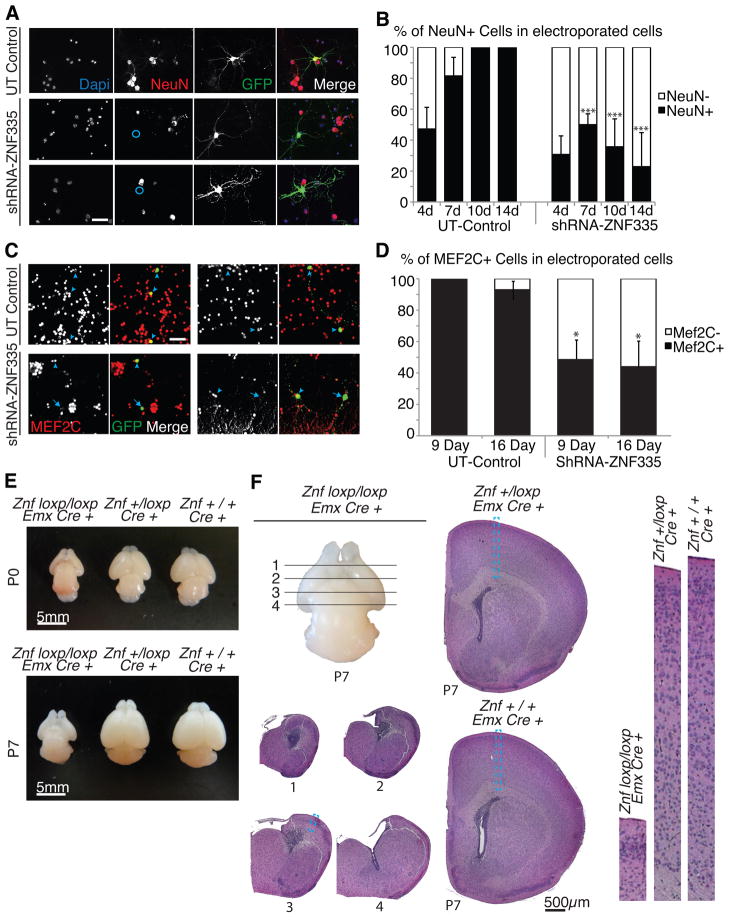
Microcephaly is a neurodevelopmental disorder causing significantly reduced cerebral cortex size. Many known microcephaly gene products localize to centrosomes, regulating cell fate and proliferation. Here, we identify and characterize a nuclear zinc finger protein, ZNF335/NIF-1, as a causative gene for severe microcephaly, small somatic size, and neonatal death. Znf335 null mice are embryonically lethal, and conditional knockout leads to severely reduced cortical size. RNA-interference and postmortem human studies show that ZNF335 is essential for neural progenitor self-renewal, neurogenesis, and neuronal differentiation. ZNF335 is a component of a vertebrate-specific, trithorax H3K4-methylation complex, directly regulating REST/NRSF, a master regulator of neural gene expression and cell fate, as well as other essential neural-specific genes. Our results reveal ZNF335 as an essential link between H3K4 complexes and REST/NRSF and provide the first direct genetic evidence that this pathway regulates human neurogenesis and neuronal differentiation.


Figures

Figure 1
Figure 1. A new syndrome of severe microcephaly and neuronal degeneration
(A) Pedigree of family with severe microcephaly. Double lines: consanguineous marriages. Black shading: known affected. Diagonal line: deceased at time of publication. Asterisk (*): sequence analysis was completed on the individual. (B) Cortical histology of patient vs. age-matched controls at 10X (left panels) and 40X (right panels) magnification. Patients show decreased cortical thickness and abnormal cortical layers. Scale: 300μm. (C) MRI of patient vs. age-matched controls show decreased brain size including cerebellum and brain stem, increased extraaxial space, and enlarged ventricles. Whole brains are outlined in yellow, showing separation of brain from skull. (D) Cerebellar histology. Calbindin-stained sections of patients vs. age-matched controls. Patients have persistent external granule cell layer (EGL), decreased molecular layer (ML), abnormal Purkinje cell layer (PCL), and decreased internal granule cell layer (IGL). Scale: 100μm. (E) Patients have unmigrated EGL cells above a thinner molecular layer (top panels, arrow). Patients have severely reduced granule cell density compared to control (bottom panels, arrowhead). Scale: 50μm. See also Supplemental Experimental Procedures.
Figure 2
Figure 2. Severe microcephaly reflects a splicing/missense mutation ZNF335
(A) Patients show linkage at chromosome 20q13.12. Sequencing shows a c.3332g>a mutation in gene ZNF335. Upper panel: schematic of chromosome 20. Middle panel: single nucleotide polymorphism genotyping. Each column represents a SNP, and the red and blue indicate homozygosity, whereas yellow shows heterozygosity. A large region (boxed) shows mainly red and blue SNPs in affected patients with heterozygosity in parents. Bottom panel: representative sequencing data. (B) Mutation is at 5′ Splice site of ZNF335 and leads to R1111>H missense mutation. (C) Northern blot shows production of a new larger transcript (*) in heterozygous parents and homozygous patients. (D) Schematic of exons and intronic splicing for a control and the predicted problems with intronic splicing in a patient with a c.3332g>a mutation. Schematic of RNA-sequencing data shows detection of reads within exons (blue), and within introns (yellow) upstream and downstream of the mutation-containing exon. Incomplete splicing is present in heterozygous parents and homozygous patients but not in control cells. RNA-sequencing data also detected the base change mutation (*). (E) Predicted structure of ZNF335. Mutation lies in the last zinc finger motif. (F) Western blot of patient lymphoblast cell lines show heterozygous parents and homozygous patients produce a reduced amount of full length ZNF335 protein, and no evidence of larger or degraded protein products. See also Fig S1.
Figure 3
Figure 3. Znf335 is essential for mouse development and is expressed in nuclei of progenitor cells
(A) Location of genetrap insertion of two genetrap mice leading to early truncation of protein to mimic a null allele. (B) Znf335 is expressed at E8.5 in developing forebrain (fb), midbrain (mb), somites (S), Branchial arch (ba), Forelimb bud (flb). Scale: 300μm. (C) Western blot analysis of Znf335 protein expression throughout brain development. In the cortex, expression is highest at E13.5 before tapering off and returns slightly postnatally. (D) Immunohistochemistry shows Znf335 expression in progenitor cells at E8.5 and in the ventricular zone of developing cortex and not in NeuN+ neurons at E12.5 and E14.5. Protein is also expressed throughout cortical plate later in development. Scale: 50, 50, 50, 400μm. (E) Znf335 localizes to the nucleus, and colocalizes with euchromatin of progenitor cells in the ventricular zone of developing mouse brain, while Znf335 is excluded from heterochromatic foci. This colocalization disappears in cells in the M-Phase of the cell cycle. Scale: 10μm. (F) Sparse expression of Znf335 in adult cerebral cortex. Scale: 100μm. See also Fig S2.
Figure 4
Figure 4. Znf335 is essential for progenitor cell proliferation and cell cycle maintenance
(A) Growth curves of lymphoblast cell lines derived from heterozygous parent, homozygous patient and control shows decreased growth rate in cells from patient with low levels of mutated ZNF335. (B) Knockdown of Znf335 leads to decreased formation of progenitor cell reaggregates in E9.5 and E12.5 progenitor cell cultures showing decreased proliferation upon knockdown of Znf335. E9.5: UT-Control, 15.25 +/− 4.3; ShRNA-ZNF335, 7.1 +/−2.9, T-test, p=0.0032, n=6; E12.5 UT-Control, 82.2 +/− 11.5; ShRNA-ZNF335, 51.6+/− 11.6, Data are representated as mean +/−SD. T-Test, p=0.001; n=6 rounds of FACS sorting. Each sort is from pooled embryos from 3 different dams with roughly half of their embryos electroporated with either shRNA-Znf335 or UT-control constructs. (C) shRNA-ZNF335 knockdown leads to fewer cells present within the ventricular zone when compared to UT-Control. WT-ZNF335 rescues the number of progenitors but MUT-ZNF335 does not. Scale: 10μm. (D) shRNA-ZNF335 knockdown leads to fewer cycling progenitors in the ventricular zone as compared to the UT-Control. Scale: 10μm. (E) Quantification of 4C. Knockdown of Znf335 leads to fewer percentage of targeted cells present within 250μm2 of the ventricular zone as compared to UT-Control. WT-ZNF335 rescues the amount of GFP-staining cells in the VZ while MUT does not. UT-Control: 7.59 +/− 0.09; ShRNA-ZNF335: 4.0 +/− 0.25; shRNA+WT: 6.27 +/− 0.7; shRNA+MUT: 4.74 +/− 0.8, mean+/−SD, T-test, P=0.0001; n=12 means of different electroporated litters. (F) Knockdown of Znf335 leads to fewer cells that are BrdU positive 48hours post knockdown within 50μm2 of the ventricular zone as compared to UT-Control. UT-Control: 38.8 +/− 2.9; shRNA-ZNF335: 20.4 +/− 1.7, mean +/−SEM, T-test, P=0.0001; n=12 electroporated brains that were analyzed using serial sections). (G) Knockdown of Znf335 leads to increased cell cycle exit (decreased BrdU+/Ki67+ cells out of total BrdU+ cells) as compared to UT-Control. (WT-Control: 0.34 +/− 0.03; UT-Control: 0.30 +/− 0.02; ShRNA-ZNF335: .66 +/− 0.04, mean+/−SD, ANOVA, P<0.0001; n=12 electroporated brains that were analyzed used serial sections). (H) Knockdown of Znf335 leads to more targeted cells in the lower layers of the mouse cortex and fewer targeted cells in upper layers of the mouse cortex, indicating more premature neurogenesis upon knockdown of Znf335. Earlier born neurons reside in deeper layers vs. later born neurons that reside in the upper layers. Scale: 50μm. (I) Cortex was divided into equal-sized bins and counted for proportion of targeted cells present in that bin. UT-Control: Bin1: 10.6 +/− 4.9; Bin2: 25.8 +/?− 3.7; Bin3: 34.6 +/− 5.2; Bin 4: 29.1 +/− 4.8; shRNA-ZNF335: Bin1: 8.1 +/− 7.1; Bin2: 16.5 +/− 6.1; Bin3: 20.7 +/− 3.6; Bin4: 54.7 +/− 5.1. mean+/−SD, T-test; Bin3:P=0.0003, Bin4:P=0.0001; n=12 electroporated brains. Only matching sections between conditions were compared. See also Fig S3.
Figure 5
Figure 5. Znf335 deficiency leads to decreased cell size, and abnormal dendritic shape and orientation
(A) Knockdown of ZNF335 leads to reduction of cells in the cortical plate and production of Cux1-negative (white circles) and FoxP1-positive (blue circles) cells showing a change in cell fate. Dashed line represents end of zone containing GFP-positive cells. Scale: 50μm. (B) Knockdown and control cells were targeted at E14.5 and analyzed at P0 (a,b), P6 (c,d) to show abnormal radial glia (P0, arrowhead) and abnormal cell body shape and size (P6, dashed circle). There is abnormal dendritic arborization (arrowhead) and orientation in knockdown cells at P8 (e,f), P16 (g,h), P22 (i,j,k), and P30 (l,m,n). Scale: 50μm. (C) Analysis of 5A. Knockdown showed production of more Cux1-negative cells as compared to Control, and production of more FoxP1-positive cells as compared to Control. (D). Knockdown cells show abnormal orientation based on orientation of their basal dendritic process which is normally perpendicular to the pial surface of the brain. WT-ZNF335 rescues the orientation but MUT-ZNF335 does not. Scale: 50μm. 0.92 of total UT-Control cells have apical process orientated perpendicular to pial surface (0°), 0.03 at 22.5°, and 0.04 at 337.5°. shRNA-ZNF335 knockdown cells have only 0.25 of total cells oriented at 0°, 0.13 at 22.5°, 0.11 at 45°, 0.08 at 67.5°, 0.04 at 90°, 0.04 at 270°, 0.08 at 292.5°, 0.12 at 315°, and 0.13 at 337.5°. WT-ZNF335 rescue of shRNA-ZNF335 knockdown have 0.7 cells at 0 °, 0.03 at 22.5 °, 0.05 at 45 °, 0.3 at 67.5 °, 0.04 at 90 °, 0.02 at 270 °, 0.03 at 292.5 °, 0.07 at 315 °, and 0.05 at 337.5 °. MUT-ZNF335 rescue of shRNA-ZNF335 knockdown have 0.4 cells at 0 °, 0.1 at 22.5 °, 0.11 at 45 °, 0.06 at 67.5 °, 0.01 at 90 °, 0.03 at 270 °, 0.06 at 292.5 °, 0.08 at 315 °, and 0.14 at 337.5 °. Data presented as proportion of total cells oriented in +/−11.25 ° of radial direction n=6 electroporated brains. Only matching sections were analyzed between different conditions. See also Fig S4.
Figure 6
Figure 6. Znf335 interacts with trithorax complex proteins and is upstream of many neuronal differentiation genes including REST/NRSF
(A) Blots show co-immunoprecipitation of Znf335 with members of the trithorax complex in human cell lines and mouse E14.5 cortex indicating an interaction of Znf335 with the histone mehtyltransferase complex. (B) Znf335 binds to promoter region of REST/NRSF, and overlaps peaks of H3K4me3 binding. (C) Promoter Binding consensus motif for Znf335 with GAGAG motif that is predicted for C2H2 zinc fingers (Omichinski et al., 1997). (D) Decreased binding of trithorax complex proteins such as WDR5 to the REST promoter under low levels of Znf335. WDR5: Control: 1.09 +/− 0, Het Parent: 0.16 +/− 0.25, Hom Patient: 0.28 +/− 0.27; chromatin was obtained and compiled from 3 different growth cultures. Two IPs were performed for each pooled set of chromatin isolated from lymphoblast cell lines, and qPCR was run in triplicates in comparison to input. All qPCR runs were normalized to GAPDH. (E) Decreased H3K4 trimethylation (marker of gene activation) of the REST promoter under low levels of Znf335, but no changes in H3K27 trimethylation. H3K4me3: Control: 4.5 +/− 0.39, Het Parent: 2.25 +/− 0.53, Hom Patient: 0.84 +/− 0.3; H3K27me3: Control: 0.95 +/− 0.37; Het Parent: 0.85 +/− 0.29; Hom Patient: 0.6, +/− 0.25; chromatin was obtained and compiled from 3 different growth cultures. Two IPs were performed for each pooled set of chromatin isolated from lymphoblast cell lines, and qPCR was run in triplicates in comparison to input. All qPCR runs were normalized to GAPDH. (F) qPCR measurement show lower levels of properly spliced ZNF335 expression and hREST expression in het parents and hom patients as compared to controls. ZNF335 analysis was done with primers specific to only the properly spliced mRNA. Incomplete splice forms would not have been picked up with primer pairs (Exon19F, Exon 20R, Exon21R): Control: 1 +/− 0.28, Het Parent: 0.80 +/− 0.21, Hom Patient: 0.15 +/− 0.03; hREST: Control: 1 +/− 0.25; Het Parent: 0.59 +/− 0.18; Hom Patient: 0.05, +/− 0.01; Mean+/−SD, T-test compared to control, homozygous patients p<0.001; n=9 qPCR readouts from 3 different growth cultures. RNA was extracted from lymphoblast cell lines. All qPCR runs were normalized to NMYC and GAPDH. (G) Decreased levels of hREST expression is seen upon direct knockdown of ZNF335. Control: 1, ZNF335: 0.41 +/− 0.12, P=0.0001; hREST: 0.48 +/− 0.20, P=0.0001; Mean+/−SD, T-test; n=6 individual transfections of HeLa cell lines. All qPCR runs were normalized to GAPDH. (H) Converserly, ZNF335 expression is not significantly changed upon expression of Dominant-Negative REST, or overexpression of hREST. 6H: GFP Control: 0.85 +/− 0.09; DN-REST: 0.97 +/− 0.14; Over-hREST: 0.92 +/− 0.08; Mean+/−SD, T-test, non-significant; n=3 sets of transfections of HeLa cell lines. Similar results also seen with Hek293 cells lines (data not published). All qPCR runs were normalized to GAPDH. (I) Schematic of Znf335 interacting with the trithorax complex to trimethylate H3K4 at the promoter of REST to turn on REST expression. (J) Knockdown of Znf335 leads to premature cell cycle exit and neuronal migration in cortical plate. Addition of REST rescues the phenotype and recapitulates control while addition of dominant-negative REST mimics Znf335 knockdown phenotype. Dashed line represents bottom of cortical plate. Scale: 50μm. UT-Control: 9.32 +/− 3.57; shRNA- ZNF335: 25.6 +/− 8.34; shRNA+REST rescue 11.92 +/− 5.1; UT+DN-REST rescue: 37.6 +/− 0.3. UT-shRNA P=0.0001, UT-DNREST rescue P=0.0001; Mean+/−SD, T-test; n=3 different electroporation litters, and analysis from each litter was pooled. See also Fig S5 and Tables S1–S7
Figure 7
Figure 7. Znf335 is essential for neuronal differentiation and brain development
(A) Knockdown of Znf335 leads to presence of NeuN- cells (blue circles) that nonetheless have neuronal morphology in 14 day culture systems. NeuN is a marker of differentiated neurons. Scale: 20μm. (B) Quantification of NeuN+ and NeuN- cells upon knockdown of Znf335 in short and long term culture shows decreased production of NeuN+ cells over long term culture. Control NeuN+: 4day: 48.2+/−14.1; 7day: 81.5+/−12.1; 10day: 100+/−0.9; 14day: 100+/−1.5; shRNA-ZNF335 NeuN+: 4day: 30.7+/−12.3; 7day: 50.0+/−7.0; 10day: 35.7+/−18.1; 14day: 22.9+/−19.1); Mean+/−SD, T-test, 7,10,14day: P<0.0001; n=12 separate cortical neuron cultures from 12 litters. (C) Knockdown of Znf335 leads to Mef2C- cells (arrows), while UT Control shows Mef2C+ cells (arrowhead). Scale: 20μm. (D) Quantification of Mef2C+ and Mef2C- cells shows decreased production of Mef2C+ cells upon knockdown of Znf335 in short and long term cultures. Control Mef2C+: 9day: 100+/−0.8; 16day: 93.0+/−8.2; shRNA-ZNF335 Mef2C+: 9day: 48.5+/−12.1; 16day: 44.0+/−15.2); Mean+/−SD, T-test, 9Day:P=0.0018, 16day:P=0.008; n=3 separate granule cell cultures from 3 different litters. (E) Znf335 CKO (Znfloxp/loxp;Emx1Cre+) shows decreased formation of cerebral cortex in all areas where Emx1-Cre is expressed, and a small lateral cortex in areas where Emx1-cre is reduced or turned on later at both P0 and P7. (F) H&E stain of coronal brain sections of ZnfCKO (Znfloxp/loxp;Emx1Cre+), ZnfHet (Znf+/loxp;Emx1Cre+), and ZnfWT (Znf+/+;Emx1Cre+) shows that ZnfCKO lack all cortical structure and cortical neurons. The loss of cortical brain structure leads to the formation of a small brain with a thin sheath of tissue and enlarged ventricles. Blue dashed boxed represent enlarged cortical sections (Right panels). See also Fig S6 and S7.

References

    1. Ang YS, Tsai SY, Lee DF, Monk J, Su J, Ratnakumar K, Ding J, Ge Y, Darr H, Chang B, et al. Wdr5 mediates self-renewal and reprogramming via the embryonic stem cell core transcriptional network. Cell. 2011;145:183–197. - PMC - PubMed
    1. Ballas N, Grunseich C, Lu DD, Speh JC, Mandel G. REST and its corepressors mediate plasticity of neuronal gene chromatin throughout neurogenesis. Cell. 2005;121:645–657. - PubMed
    1. Bannister AJ, Kouzarides T. Regulation of chromatin by histone modifications. Cell Res. 2011;21:381–395. - PMC - PubMed
    1. Barkovich AJ, Moore KR, Jones BV, Vezina G, Koch BL, Raybaud C, Grant PE, Blaser SI, Hedlund GL, Illner A. Diagnostic Imaging: Pediatric Neuroradiology. 1. Salt Lake City, Utah: Amirsys- Elsevier; 2007.
    1. Bernstein BE, Kamal M, Lindblad-Toh K, Bekiranov S, Bailey DK, Huebert DJ, McMahon S, Karlsson EK, Kulbokas EJ, 3rd, Gingeras TR, et al. Genomic maps and comparative analysis of histone modifications in human and mouse. Cell. 2005;120:169–181. - PubMed

Publication types

MeSH terms

Associated data