. 2013 Feb;48(2):290-7.
doi: 10.1016/j.exger.2012.11.004. Epub 2012 Nov 21.

Effects of the activin A-myostatin-follistatin system on aging bone and muscle progenitor cells

Affiliations

Effects of the activin A-myostatin-follistatin system on aging bone and muscle progenitor cells

Matthew Bowser et al. Exp Gerontol. 2013 Feb.

Abstract

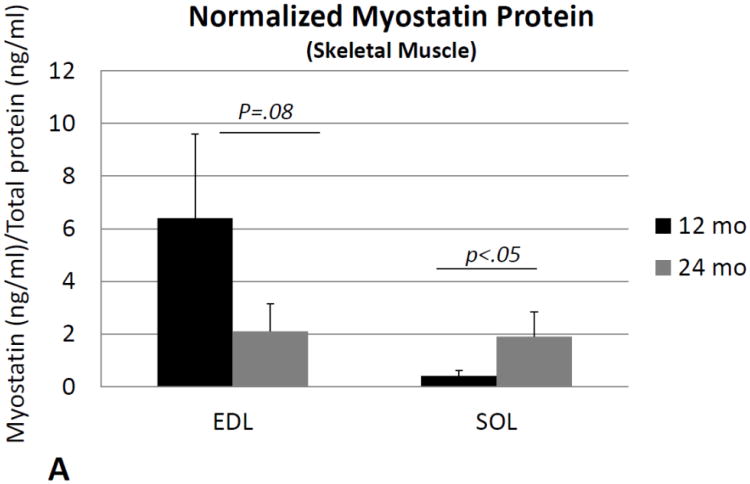
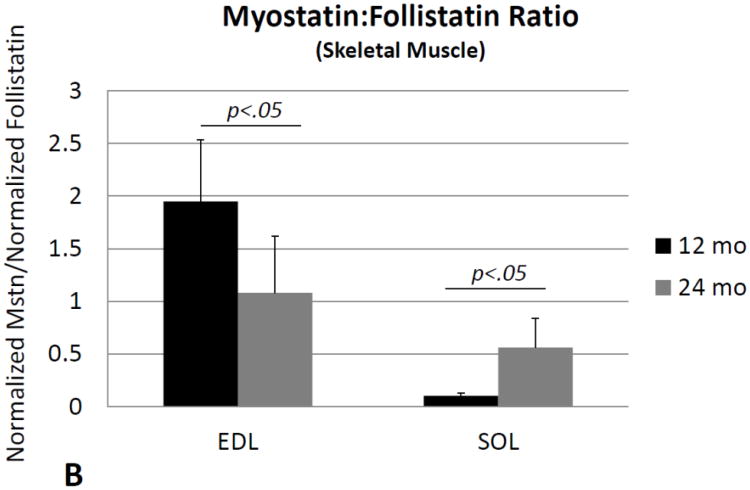
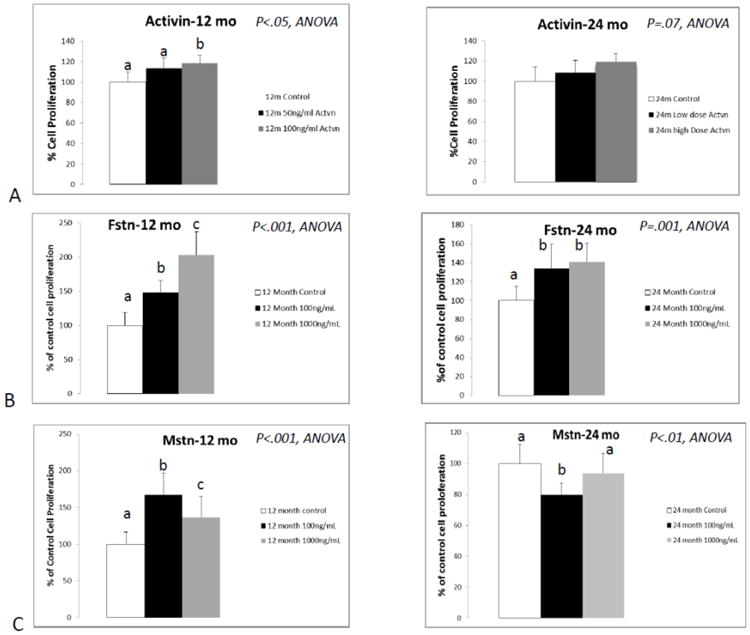
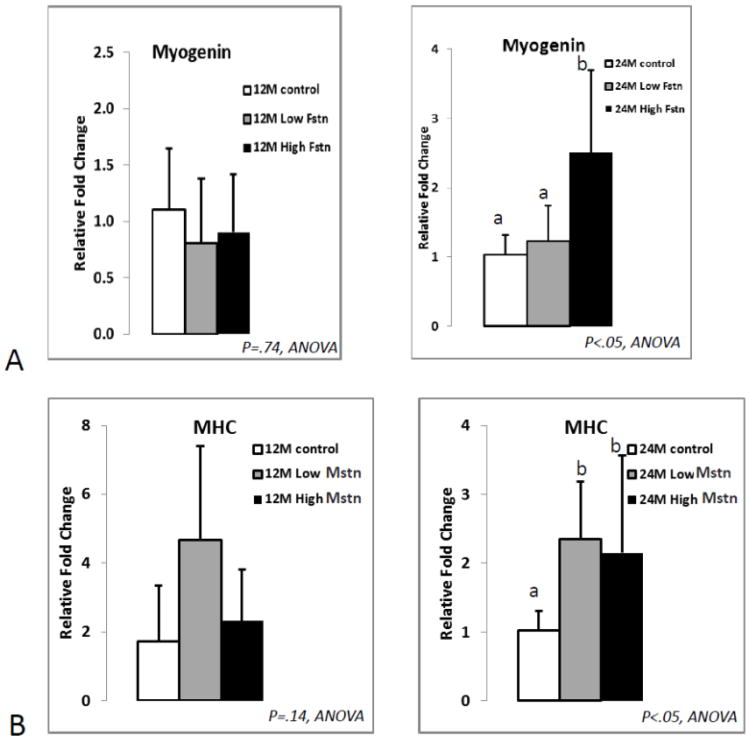
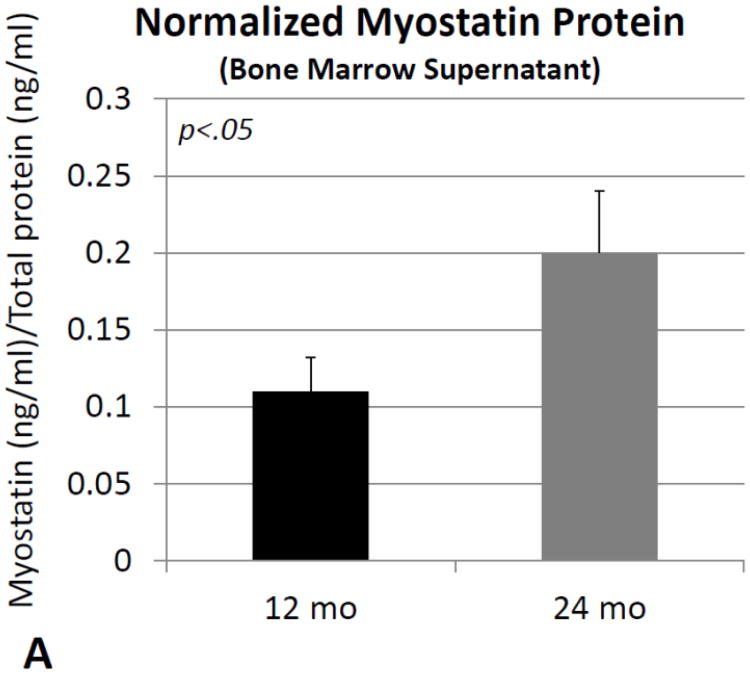
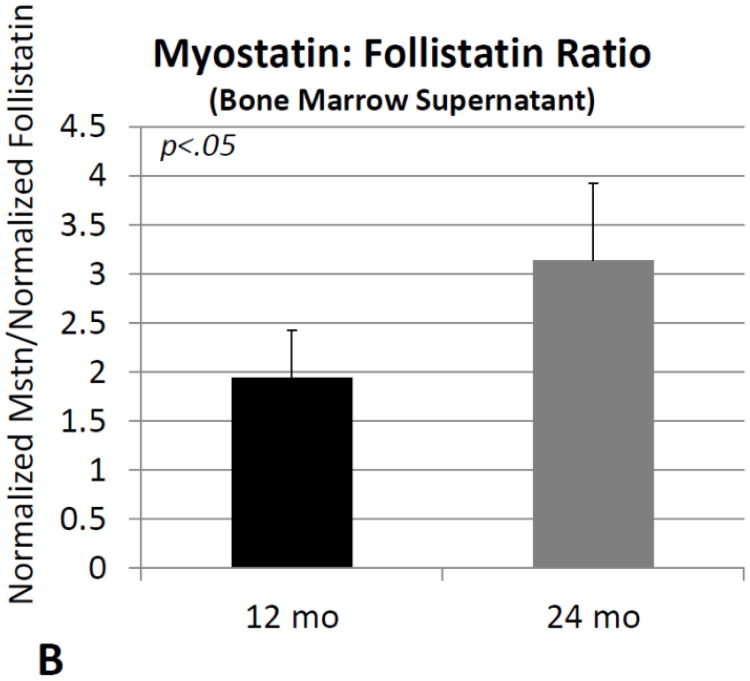
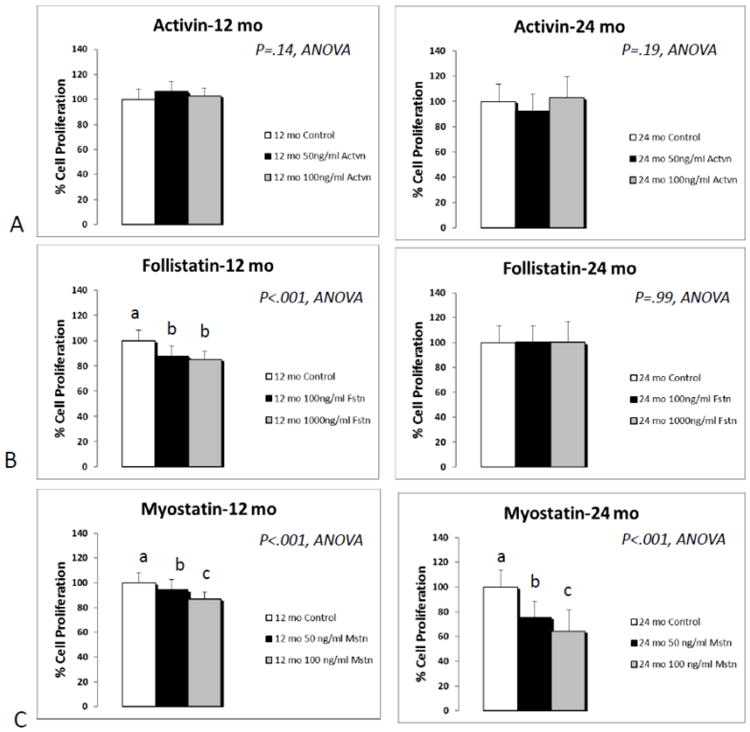
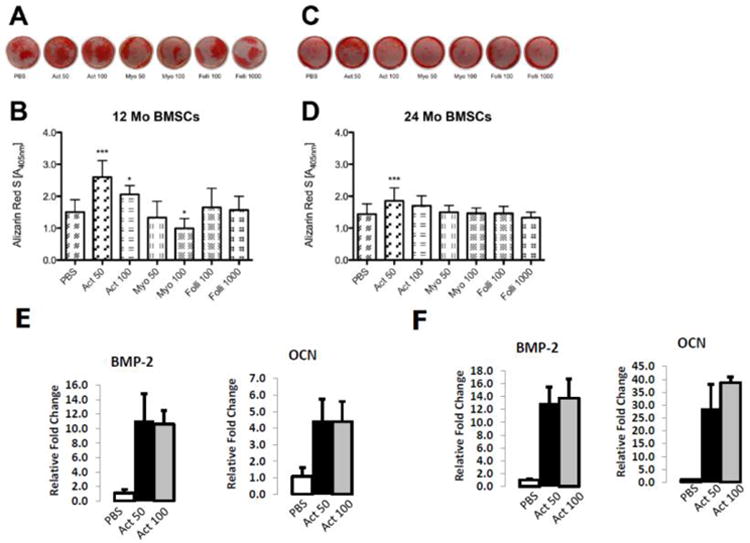
The activin A-myostatin-follistatin system is thought to play an important role in the regulation of muscle and bone mass throughout growth, development, and aging; however, the effects of these ligands on progenitor cell proliferation and differentiation in muscle and bone are not well understood. In addition, age-associated changes in the relative expression of these factors in musculoskeletal tissues have not been described. We therefore examined changes in protein levels of activin A, follistatin, and myostatin (GDF-8) in both muscle and bone with age in C57BL6 mice using ELISA. We then investigated the effects of activin A, myostatin and follistatin on the proliferation and differentiation of primary myoblasts and mouse bone marrow stromal cells (BMSCs) in vitro. Myostatin levels and the myostatin:follistatin ratio increased with age in the primarily slow-twitch mouse soleus muscle, whereas the pattern was reversed with age in the fast-twitch extensor digitorum longus muscle. Myostatin levels and the myostatin:follistatin ratio increased significantly (+75%) in mouse bone marrow with age, as did activin A levels (+17%). Follistatin increased the proliferation of primary myoblasts from both young and aged mice, whereas myostatin increased proliferation of younger myoblasts but decreased proliferation of older myoblasts. Myostatin reduced proliferation of both young and aged BMSCs in a dose-dependent fashion, and activin A increased mineralization in both young and aged BMSCs. Together these data suggest that aging in mice is accompanied by changes in the expression of activin A and myostatin, as well as changes in the response of bone and muscle progenitor cells to these factors. Myostatin appears to play a particularly important role in the impaired proliferative capacity of muscle and bone progenitor cells from aged mice.


Figures

Fig. 1
Fig. 1
Myostatin protein normalized to total protein (A) and the ratio of normalized myostatin to follistatin (B) in the extensor digitorum longus muscle (EDL) and soleus (SOL) of mice 12 months of age (12 mo) and 24 months of age (24 mo). Myostatin levels decline with age in the EDL but increase with age in the soleus. Error bars represent one standard deviation and sample size includes six replicates per group.
Fig. 1
Fig. 1
Myostatin protein normalized to total protein (A) and the ratio of normalized myostatin to follistatin (B) in the extensor digitorum longus muscle (EDL) and soleus (SOL) of mice 12 months of age (12 mo) and 24 months of age (24 mo). Myostatin levels decline with age in the EDL but increase with age in the soleus. Error bars represent one standard deviation and sample size includes six replicates per group.
Fig. 2
Fig. 2
Results of proliferation assays following treatment of primary myoblasts with activin A (A; activin), follistatin (B; Fstn), and myostatin (C; Mstn). Means with different superscripts differ significantly from one another (P<.05). Error bars represent one standard deviation and sample size includes eight replicates per group.
Fig. 3
Fig. 3
Real-time PCR data for primary myoblast expression of myogenin (A) and myosin heavy chain (B) in response to treatment with follistatin (Fstn, top) and myostatin (Mstn, bottom). Means with different superscripts differ significantly from one another (P<.05). Error bars represent one standard deviation and sample size includes four-six replicates per group.
Fig. 4
Fig. 4
Myostatin protein normalized to total protein (A) and the ratio of normalized myostatin to follistatin (B) in bone marrow supernatants from mice 12 months of age (12 mo) and 24 months of age (24 mo). Error bars represent one standard deviation and sample size includes six replicates per group.
Fig. 4
Fig. 4
Myostatin protein normalized to total protein (A) and the ratio of normalized myostatin to follistatin (B) in bone marrow supernatants from mice 12 months of age (12 mo) and 24 months of age (24 mo). Error bars represent one standard deviation and sample size includes six replicates per group.
Fig. 5
Fig. 5
Results of proliferation assays following treatment of primary bone marrow stromal cells (BMSCs) with activin A (A; activin), follistatin (B; Fstn), and myostatin (C; Mstn). Means with different superscripts differ significantly from one another (P<.05). Error bars represent one standard deviation and sample size includes eight replicates per group.
Fig. 6
Fig. 6
Alizarin red staining of bone marrow stromal cells cultured in osteogenic conditions (A-D) and PCR data for osteogenic genes (E-F) from BMSCs treated with activin A. Images of wells (A, C) and quantification of staining (B, D) in BMSCs from young mice (A, B; 12 Mo BMSCs) and older mice (C, D; 24 Mo BMSCs) treated with Activin A (Act), Myostatin (Myo) or Follistatin (Folli) at 50 ng/ml (50), 100 ng/ml (100) or 1000 ng/ml (1000). ***P<.001, *P<.05 relative to same-aged PBS controls. Error bars represent one standard deviation and sample size includes sixteen replicates per group for panels A-D. PCR data show elevated expression of osteogenic genes BMP-2 and osteocalcin (OCN) in activin-treated cells from mice 12 months of age (E) and mice 24 months of age (F). Error bars represent one standard deviation and four replicates are included per treatment group.

References

    1. Baccarelli A, Morpurgo P, Corsi A, Vaghi I, Fanelli M, Cremonesi G, Vaninetti S, Beck-Peccoz P, Spada A. Activin A serum levels and aging of the pituitary-gonadal axis: a cross-sectional study in middle-aged and elderly healthy subjects. Exp Gerontol. 2001;36:1403–12. - PubMed
    1. Conboy I, Conboy MJ, Smythe G, Rando TM. Notch-mediated restoration of regenerative potential to aged muscle. Science. 2003;302:1575–177. - PubMed
    1. Dalbo VJ, Roberts MD, Sunderland KL, Poole CN, Stout JR, Beck TW, Bemben M, Kerksick CM. Acute loading and aging effects on myostatin pathway biomarkers in human skeletal muscle after three sequential bouts of resistance exercise. J Gerontol A Biol Sci Med Sci. 2011;66:855–65. - PubMed
    1. Eijken M, Swagemakers S, Koedam M, Steenbergen C, Derkx P, Uitterlinden AG, van der Spek PJ, Visser JA, de Jong FH, Pols HA, van Leeuwen JP. The activin A-follistatin system: potent regulator of human extracellular matrix mineralization. FASEB J. 2007;21:2949–60. - PubMed
    1. Elkasrawy MN, Hamrick MW. Myostatin (GDF-8) as a key factor linking muscle mass and bone structure. J Musculoskelet Neuronal Interact. 2010;10:56–63. - PMC - PubMed

Publication types

MeSH terms