. 2013 Oct 17;32(42):5089-100.
doi: 10.1038/onc.2012.525. Epub 2012 Nov 26.

Mechanism and relevance of EWS/FLI-mediated transcriptional repression in Ewing sarcoma

Affiliations

Mechanism and relevance of EWS/FLI-mediated transcriptional repression in Ewing sarcoma

S Sankar et al. Oncogene. .

Erratum in

Abstract

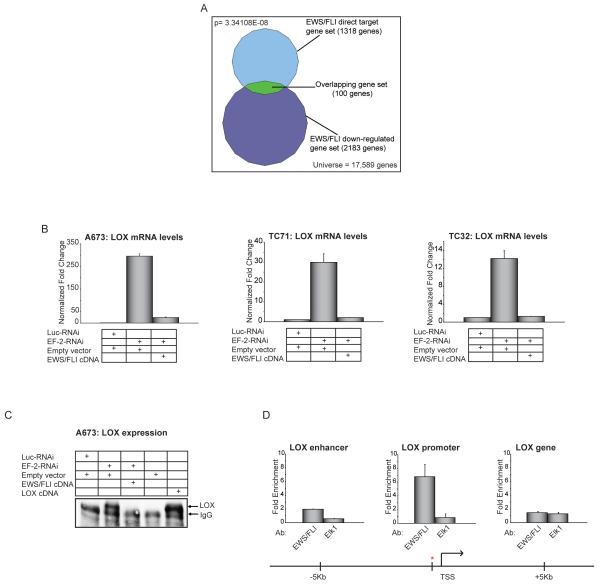
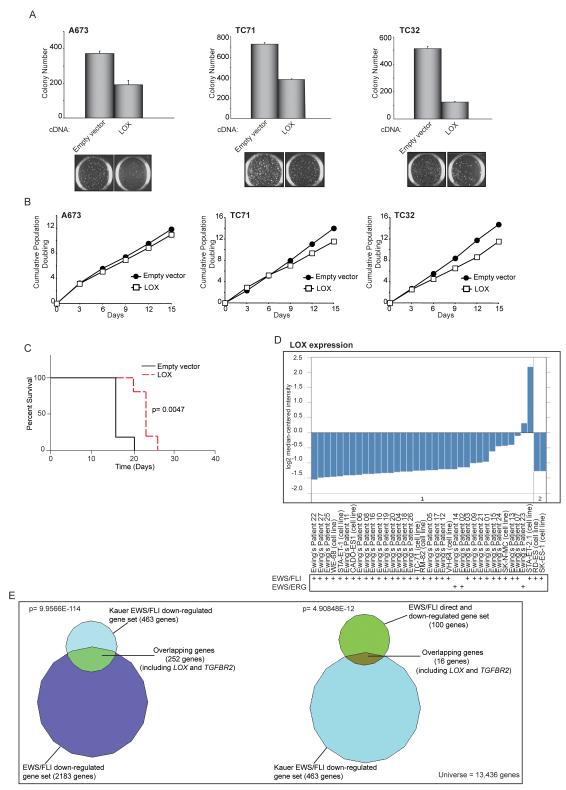
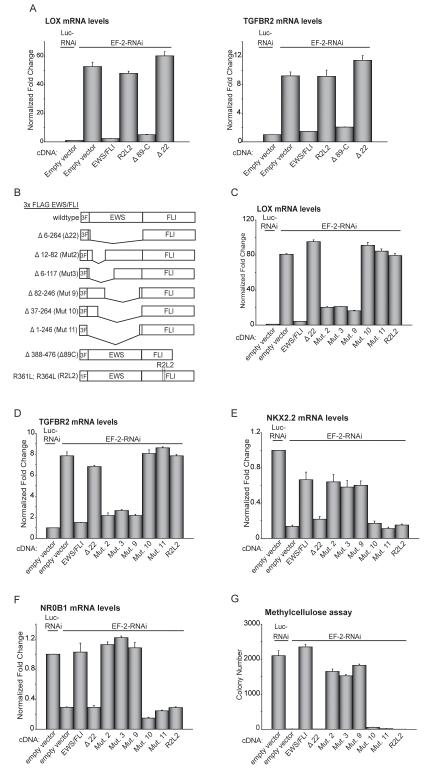
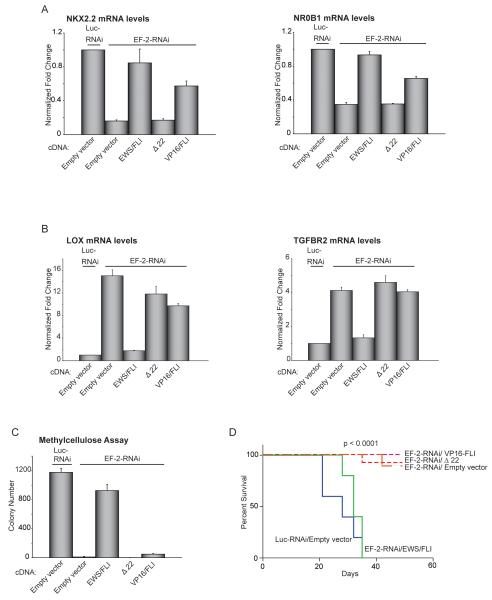
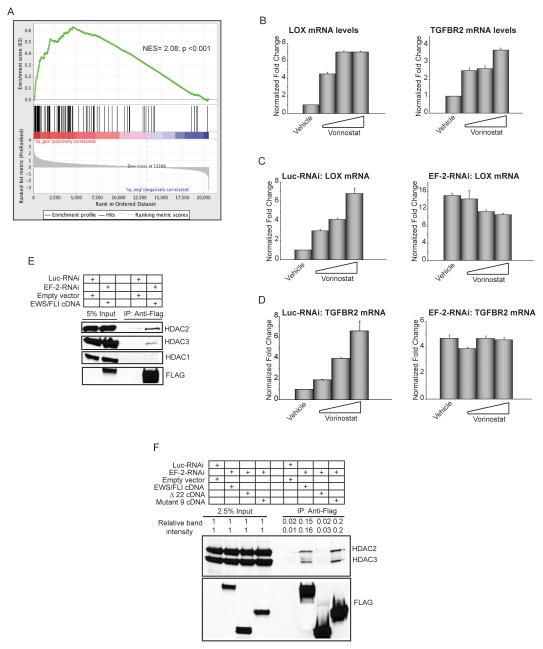
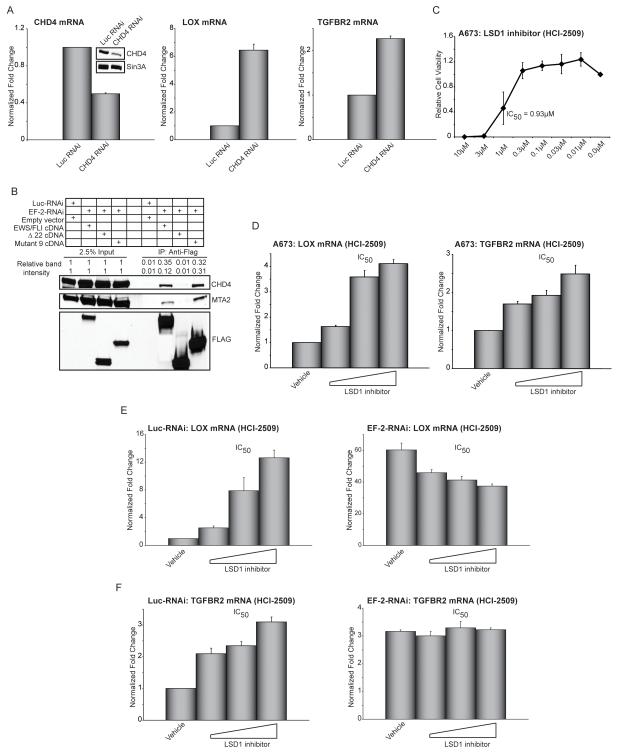
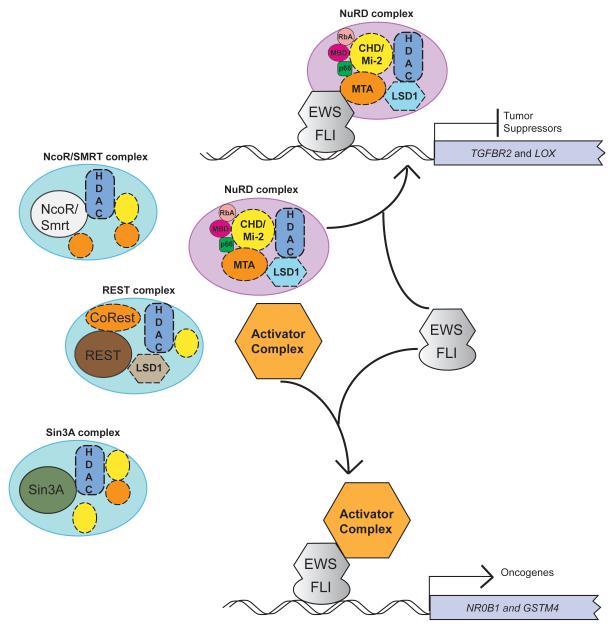
Ewing sarcoma provides an important model for transcription-factor-mediated oncogenic transformation because of its reliance on the ETS-type fusion oncoprotein EWS/FLI. EWS/FLI functions as a transcriptional activator and transcriptional activation is required for its oncogenic activity. Here, we demonstrate that a previously less-well characterized transcriptional repressive function of the EWS/FLI fusion is also required for the transformed phenotype of Ewing sarcoma. Through comparison of EWS/FLI transcriptional profiling and genome-wide localization data, we define the complement of EWS/FLI direct downregulated target genes. We demonstrate that LOX is a previously undescribed EWS/FLI-repressed target that inhibits the transformed phenotype of Ewing sarcoma cells. Mechanistic studies demonstrate that the NuRD co-repressor complex interacts with EWS/FLI, and that its associated histone deacetylase and LSD1 activities contribute to the repressive function. Taken together, these data reveal a previously unknown molecular function for EWS/FLI, demonstrate a more highly coordinated oncogenic transcriptional hierarchy mediated by EWS/FLI than previously suspected, and implicate a new paradigm for therapeutic intervention aimed at controlling NuRD activity in Ewing sarcoma tumors.


Figures

Figure 1
Figure 1. Identification of direct downregulated targets of EWS/FLI
(A) Venn diagram representation of the overlap between EWS/FLI downregulated genes (by transcriptional profiling) and EWS/FLI direct targets (by ChIP-chip) in A673 Ewing sarcoma cells. The Chi square-determined p-value is indicated. (B) qRT-PCR validation of EWS/FLI mediated transcriptional repression of LOX in A673, TC71 and TC32 Ewing sarcoma cells following retroviral knockdown of endogenous EWS/FLI (EF-2-RNAi, versus the negative-control Luc-RNAi) and rescue with an RNAi-resistant EWS/FLI cDNA (versus an empty vector control). Error bars indicate standard deviations. Normalized fold enrichment was calculated by determining the fold-change of each condition relative to the control Luc-RNAi condition, with the data in each condition normalized to an internal housekeeping control gene GAPDH. (C) Immunoprecipitation-Western blot analysis of LOX protein from A673 cells expressing the indicated RNAi constructs (Luc-RNAi negative-control versus EWS/FLI knockdown with EF-2-RNAi), and the indicated expression vectors (empty vector negative control, EWS/FLI cDNA resistant to the RNAi construct, or a LOX cDNA). The same antibody was used to perform the immunoprecipitation and the Western blotting. The IgG band refers to the heavy chain. (D) ChIP of EWS/FLI at the LOX locus using antibodies against FLI (which recognizes only EWS/FLI) or ELK1 (negative control). The ChIP experiments were performed in A673 Ewing sarcoma cells which express EWS/FLI but do not have any detectable expression of wild-type FLI (7), and so the anti-FLI antibody used only detects the fusion protein. Thus, there is no competition between the two transcription factors for the same binding sites. The red asterisk indicates the ChIP-Chip identified EWS/FLI binding site at the LOX promoter, and the transcriptional start site (TSS) is indicated. The level of enrichment for EWS/FLI or ELK1 are plotted as fold enrichment compared to the average enrichment of EWS/FLI or ELK1 at two negative control housekeeping genes ALB and BCL2L1 used as normalization controls. Elk1 immunoprecipitation is used as a negative control for the ChIP experiment. Enrichment of EWS/FLI or Elk1 at regions 5 kb upstream and downstream of the ChIP-Chip identified binding site were used as negative controls to further demonstrate binding specificity for EWS/FLI at the LOX promoter. The error bars indicate standard error of the means of five independent experiments.
Figure 2
Figure 2. LOX functions as a tumor suppressor in Ewing sarcoma
(A) Quantification of colonies formed in soft agar by A673, TC71 and TC32 cells expressing a 3X-FLAG LOX cDNA construct in comparison to an empty vector control. Error bars indicate standard deviations of duplicate assays. Representative images of soft agar colonies are included. (B) Growth assays (3T5) for A673, TC71 and TC32 cells described in (A). (C) Survival curves for immunodeficient mice injected with TC32 cells expressing 3X-FLAG LOX or an empty vector construct. Five mice underwent bilateral subcutaneous injection for each condition, and each animal was sacrificed once one of their tumors reached a 2 cm endpoint. Percent survival was plotted as a Kaplan-Meier survival curve using GraphPad Prism. The log-rank (Mantel-Cox Test) p-value is indicated. (D) Graphical representation of LOX expression levels in 27 primary Ewing sarcoma patient-derived tumors and 10 Ewing sarcoma cell lines in the Schaefer et al. dataset. The EWS/FLI or EWS/ERG translocation fusion status of each sample is indicated. The reason for the higher levels of LOX expression observed in the STA-ET-2.1 cell line is uncertain, but possibilities include that this cell line may harbor a mutant LOX allele, or perhaps has activated an adaptive “bypass” pathway that allows for growth in the presence of high levels of LOX expression (such as the effect seen in our own xenograft experiments with Ewing sarcoma cells expressing the LOX cDNA (Figures 2C and S2F). (E) Venn diagram overlaps of EWS/FLI downregulated or EWS/FLI direct downregulated-genes datasets with the Kauer et al. EWS/FLI downregulated-genes dataset. In the Kauer et al. dataset, a molecular function map of Ewing sarcoma was constructed based on an integrative analysis of gene expression profiling experiments following EWS/FLI knock-down in a panel of five Ewing sarcoma cell lines, and 59 primary Ewing sarcoma tumors using mesenchymal progenitor cells (MPC, a suggested cell-of-origin of Ewing sarcoma) as the reference tissue. The Chi-square determined p-values are indicated.
Figure 3
Figure 3. Structure-function analysis of EWS/FLI mediated repression
(A) qRT-PCR analysis of LOX and TGFBR2 expression in A673 cells following knockdown of EWS/FLI (with the EF-2-RNAi construct) and rescue with 3X-FLAG wild-type EWS/FLI, 3X-FLAG Δ22, 1X-FLAG R2L2, 3X-FLAG Δ89C, or an empty vector control. Luc-RNAi is a negative control vector. Normalized fold enrichment was calculated by determining the fold-change of each condition relative to the control Luc-RNAi condition RNAi, with the data in each condition normalized to an internal housekeeping control gene GAPDH. (B) Schematic representation of 3X-FLAG (3F) EWS/FLI wild-type and mutant constructs and 1X-FLAG (1F) R2L2 mutant construct. Amino acids deleted/mutated in the EWS and FLI1 domains are indicated. (C, D) Repression of LOX and TGFBR2, by wild-type EWS/FLI, or mutants, as analyzed by qRT-PCR. EWS/FLI was knocked-down in A673 cells and rescued with the indicated constructs. Error bars indicate standard deviations. (E, F) Activation of NKX2.2 and NR0B1, by wild-type EWS/FLI, or mutants, as analyzed by qRT-PCR. EWS/FLI was knocked-down in A673 cells and rescued with the indicated constructs. Error bars indicate standard deviations. (G) Quantification of colonies formed in methylcellulose by A673 cells infected with the indicated RNAi and cDNA constructs. Error bars indicate standard deviations of duplicate assays.
Figure 4
Figure 4. EWS/FLI-mediated transcriptional activation and transcriptional repression are required for oncogenic transformation in Ewing sarcoma cells
(A, B) qRT-PCR analysis of NKX2.2 and NR0B1, or LOX and TGFBR2, following knock-down of EWS/FLI (with the EF-2-RNAi construct) and rescue with the indicated cDNAs or an empty vector control. Luc-RNAi is a negative control. Error bars indicate standard deviations. Normalized fold enrichment was calculated by determining the fold-change of each condition relative to the control Luc-RNAi condition, with the data in each condition normalized to an internal housekeeping control gene GAPDH. (C) Quantification of colonies formed in methylcellulose by A673 cells infected with the indicated RNAi and cDNA constructs. Error bars indicate standard deviations of duplicate assays. (D) Survival curves for immunodeficient mice injected with control knock-down A673 cells re-expressing empty vector or EWS/FLI knock-down A673 cells re-expressing empty vector, EWS/FLI cDNA, Δ22 or 2x VP16/FLI cDNA constructs. Five mice underwent bilateral subcutaneous injection for each condition, and each animal was sacrificed once one of their tumors reached a 2 cm endpoint. Percent survival was plotted as a Kaplan-Meier survival curve using GraphPad Prism. The log-rank (Mantel-Cox Test) p-value is indicated.
Figure 5
Figure 5. Transcriptional repression by EWS/FLI is mediated by HDACs
(A) Gene set enrichment analysis (GSEA) using vorinostat-regulated genes in A673 Ewing sarcoma cells as the rank-ordered dataset and the 100 EWS/FLI direct downregulated targets as the geneset. The positions of the 100 genes are indicated as black vertical lines in the center portion of the panel. The normalized enrichment score (NES) and p-value are shown. (B) qRT-PCR analysis of LOX and TGFBR2 in A673 cells treated with increasing concentrations of the HDAC-inhibitor vorinostat. Normalized fold enrichment was calculated by determining the fold-change of each condition relative to the control vehicle treated condition, with the data in each condition normalized to an internal housekeeping control gene GAPDH. Error bars indicate standard deviations. (C, D) qRT-PCR analysis of LOX and TGFBR2 in A673 cells expressing a control RNAi or EWS/FLI RNAi construct (EF-2-RNAi) treated with increasing concentrations of the HDAC inhibitor vorinostat. Error bars indicate standard deviations. (E, F) Co-immunoprecipitation of EWS/FLI and HDACs. Endogenous EWS/FLI was knocked-down in A673 cells (with the EF-2-RNAi) and replaced with 3X-FLAG-tagged versions of the indicated cDNAs that were resistant to the RNAi construct. Luc-RNAi is a negative control. Relative band intensities were quantified using ImageQuant.
Figure 6
Figure 6. EWS/FLI interacts with members of the NuRD co-repressor complex
(A) qRT-PCR analysis of CHD4, LOX, and TGFBR2 in A673 cells following knock-down of the NuRD component CHD4. Western blot analysis to demonstrate efficiency of CHD4 knockdown, Sin3A was used as the loading control. Error bars indicate standard deviations. Normalized fold enrichment was calculated by determining the fold-change of each condition relative to the control Luc-RNAi condition, with the data in each condition normalized to an internal housekeeping control gene GAPDH. (B) Co-immunoprecipitation of 3X-FLAG EWS/FLI, or the indicated mutants, and NuRD complex components CHD4 and MTA2. Relative band intensities were quantified using ImageQuant. (C) Relative cell viability of A673 cells treated with increasing concentrations of the LSD1 inhibitor (HCI-2509). The IC50 is indicated. Error bars indicate standard deviations. (D) qRT-PCR analysis of LOX and TGFBR2 following 72 hours of treatment with increasing concentrations of the LSD1 inhibitor (HCI-2509). The dose corresponding to the IC50 is indicated. Error bars indicate standard deviations. (E, F) qRT-PCR analysis of LOX and TGFBR2 in A673 cells expressing Luc-RNAi (negative control) or EWS/FLI RNAi (EF-2-RNAi) following 72 hours of treatment with increasing concentrations of the LSD1 inhibitor HCI-2509. The dose corresponding to the IC50 is indicated. Error bars indicate standard deviations.
Figure 7
Figure 7. Binary switch model for EWS/FLI mediated transcriptional regulation
At directly repressed genes, such as LOX and TGFBR2, EWS/FLI may preferentially recruit transcriptional repressor complexes, such as the NuRD complex with its associated HDACs and LSD1, to transcriptionally inhibit gene expression. At other repressed loci, other repressor complexes could be recruited. In contrast, at directly activated genes, such as NR0B1 and GSTM4, EWS/FLI may preferentially recruit (yet to be determined) activator complexes to transcriptionally upregulate gene expression. The mechanism by which preferential recruitment occurs is not yet known.

References

    1. Delattre O, Zucman J, Plougastel B, Desmaze C, Melot T, Peter M, et al. Gene fusion with an ETS DNA-binding domain caused by chromosome translocation in human tumours. Nature. 1992;359:162–165. - PubMed
    1. May WA, Lessnick SL, Braun BS, Klemsz M, Lewis BC, Lunsford LB, et al. The Ewing’s sarcoma EWS/FLI-1 fusion gene encodes a more potent transcriptional activator and is a more powerful transforming gene than FLI-1. Mol Cell Biol. 1993;13:7393–7398. - PMC - PubMed
    1. Seth A, Watson DK. ETS transcription factors and their emerging roles in human cancer. Eur J Cancer. 2005;41:2462–2478. - PubMed
    1. Petermann R, Mossier BM, Aryee DN, Khazak V, Golemis EA, Kovar H. Oncogenic EWS-Fli1 interacts with hsRPB7, a subunit of human RNA polymerase II. Oncogene. 1998;17:603–610. - PubMed
    1. Ramakrishnan R, Fujimura Y, Zou JP, Liu F, Lee L, Rao VN, et al. Role of protein-protein interactions in the antiapoptotic function of EWS-Fli-1. Oncogene. 2004;23:7087–7094. - PubMed

Publication types

MeSH terms

Substances