. 2013 Oct 10;32(41):4892-902.
doi: 10.1038/onc.2012.517. Epub 2012 Nov 26.

Non-canonical Notch signaling activates IL-6/JAK/STAT signaling in breast tumor cells and is controlled by p53 and IKKα/IKKβ

Affiliations
Free PMC article

Non-canonical Notch signaling activates IL-6/JAK/STAT signaling in breast tumor cells and is controlled by p53 and IKKα/IKKβ

S Jin et al. Oncogene. .
Free PMC article

Abstract

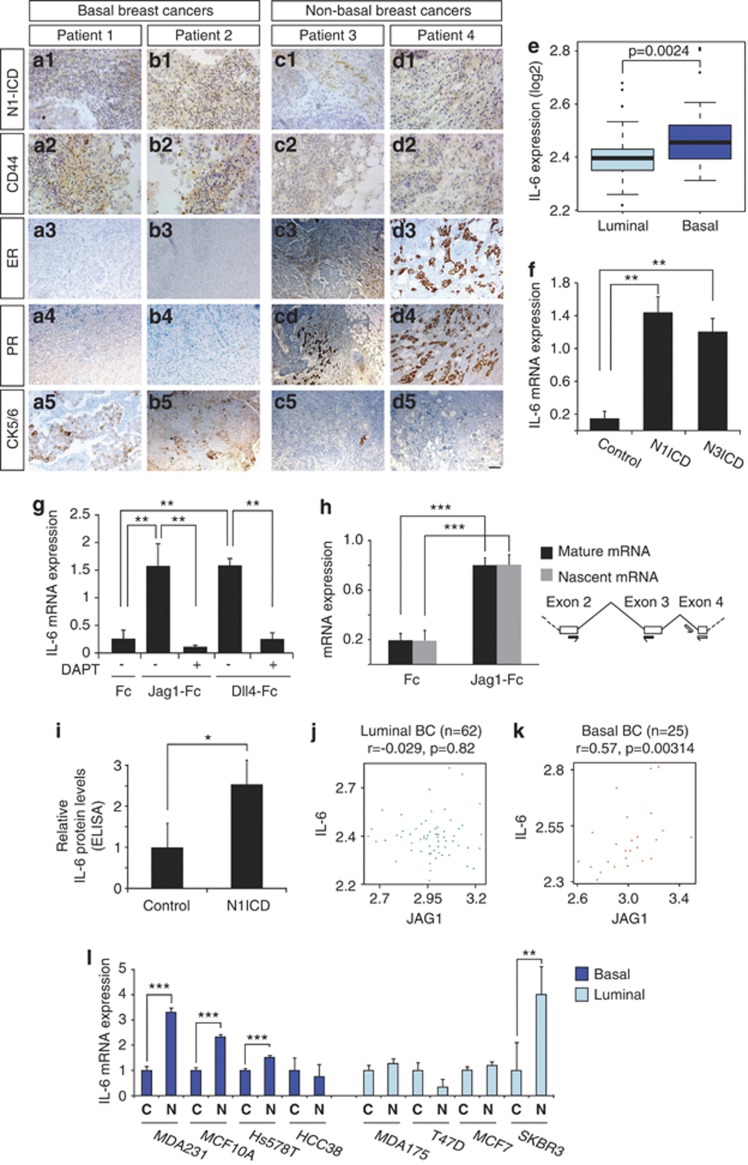
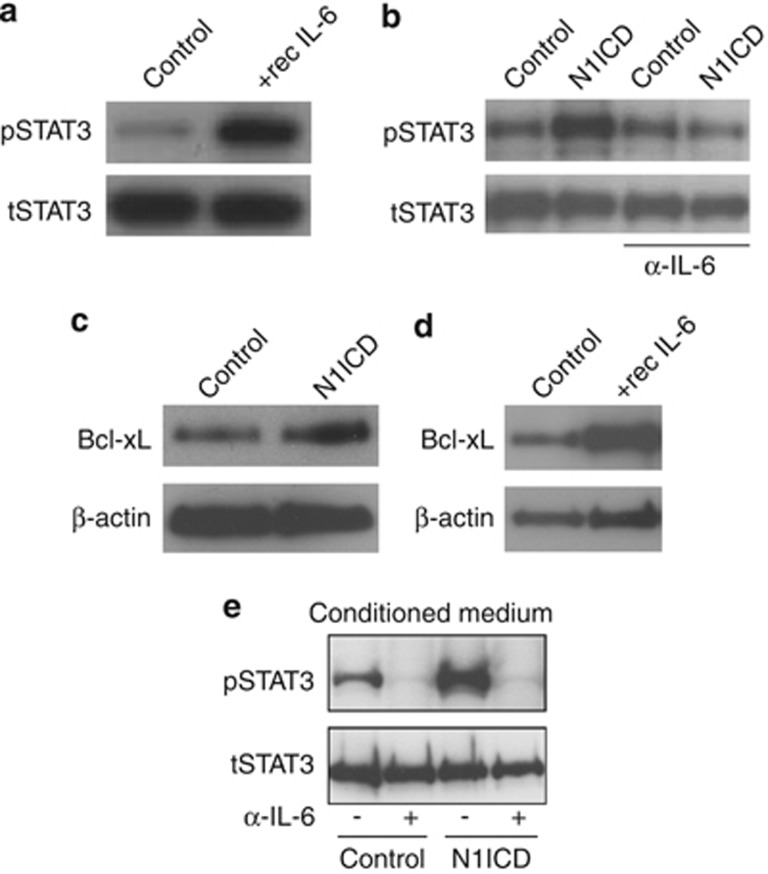
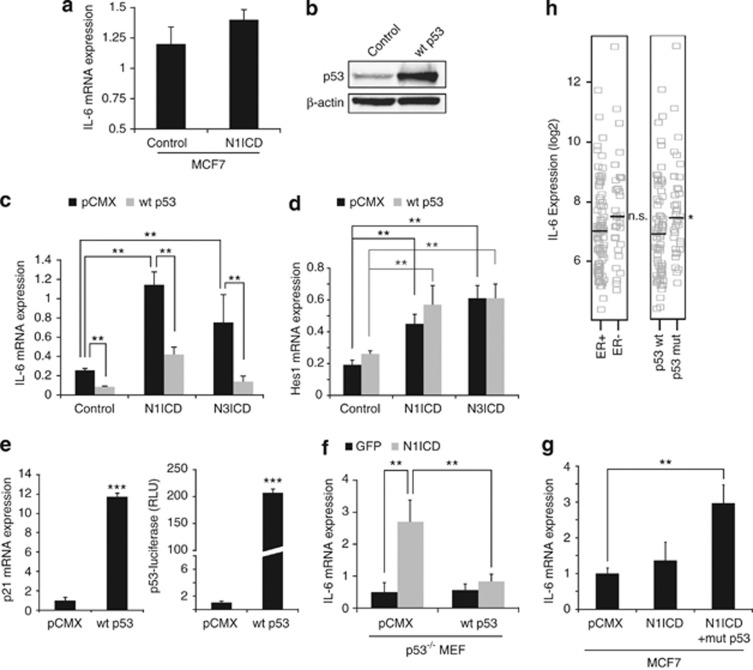
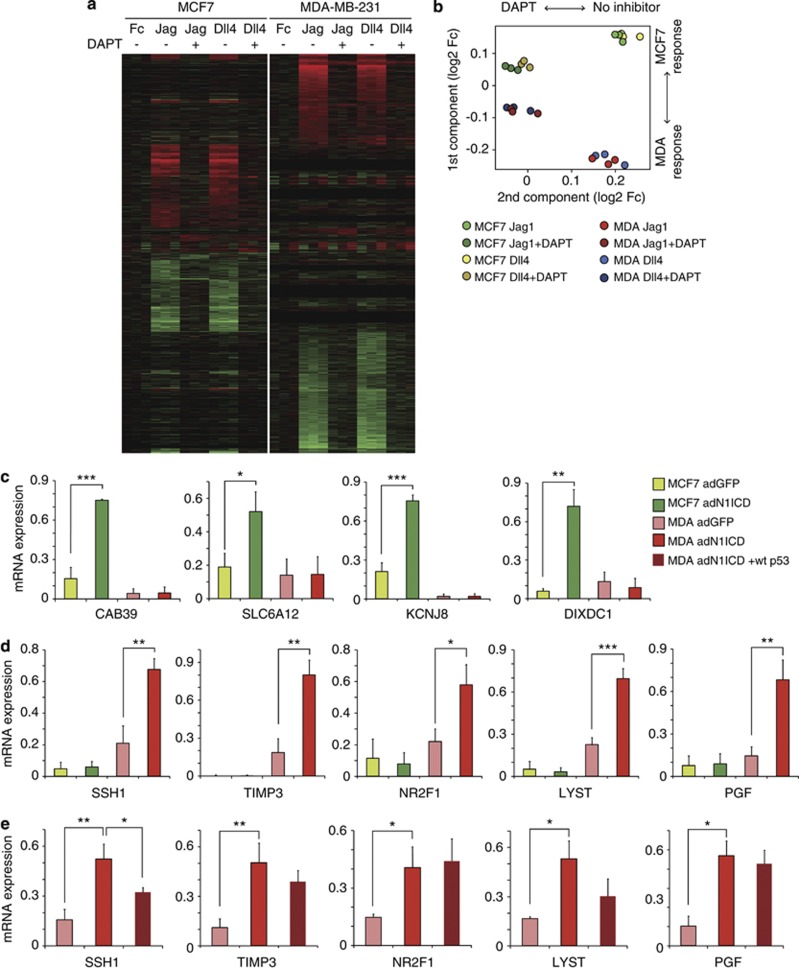
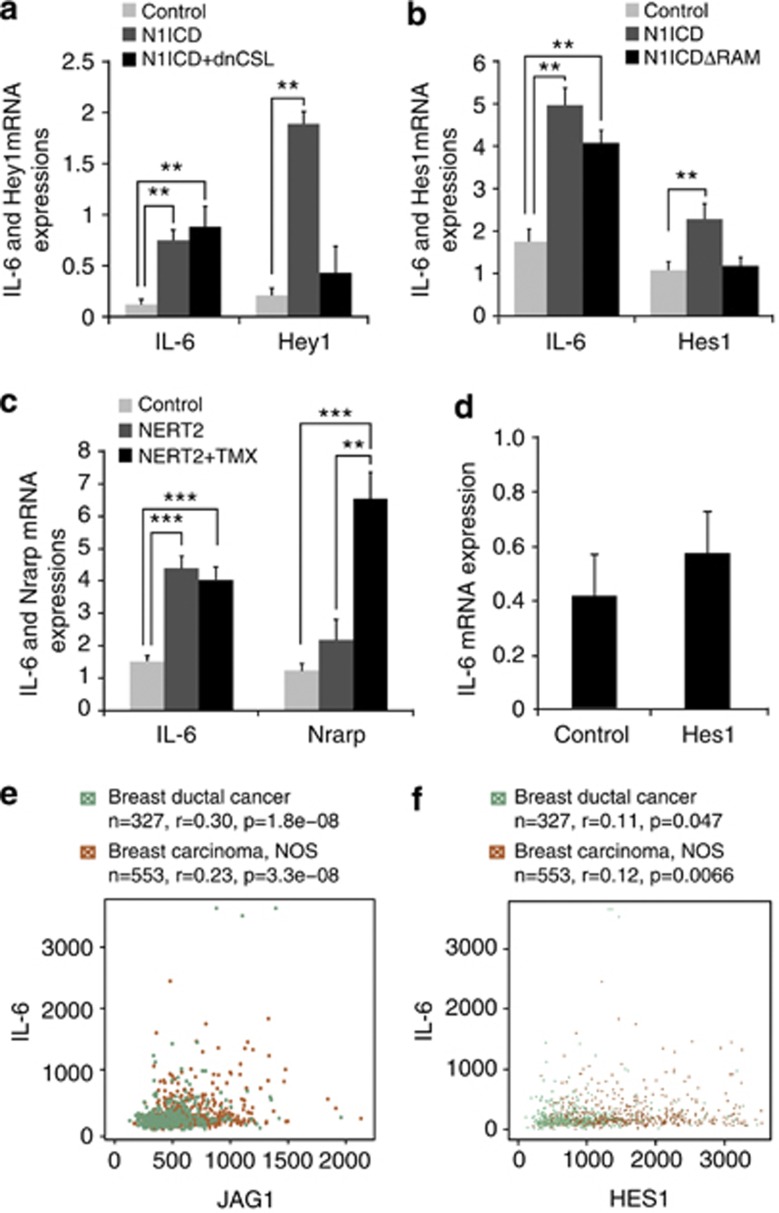
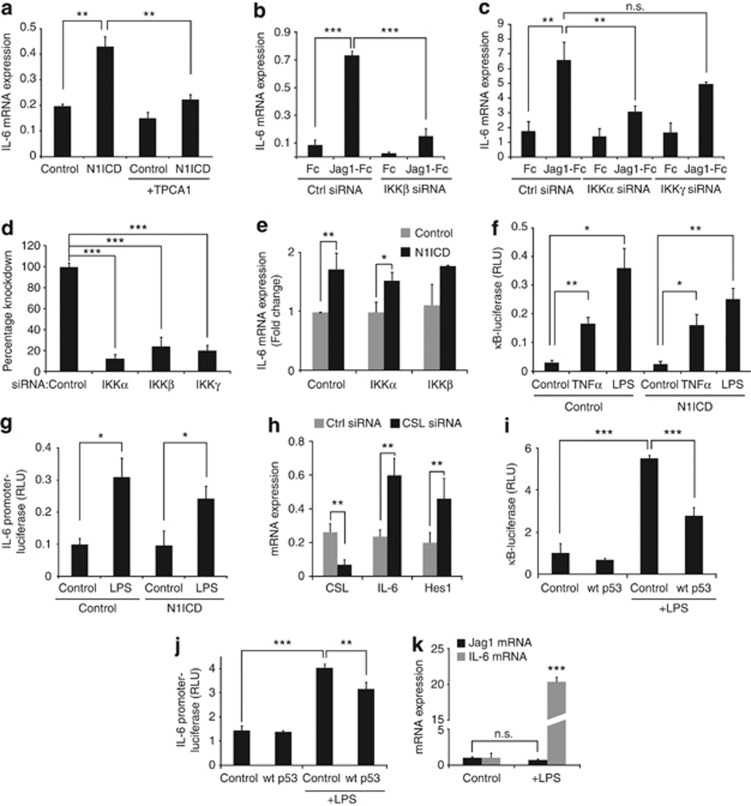
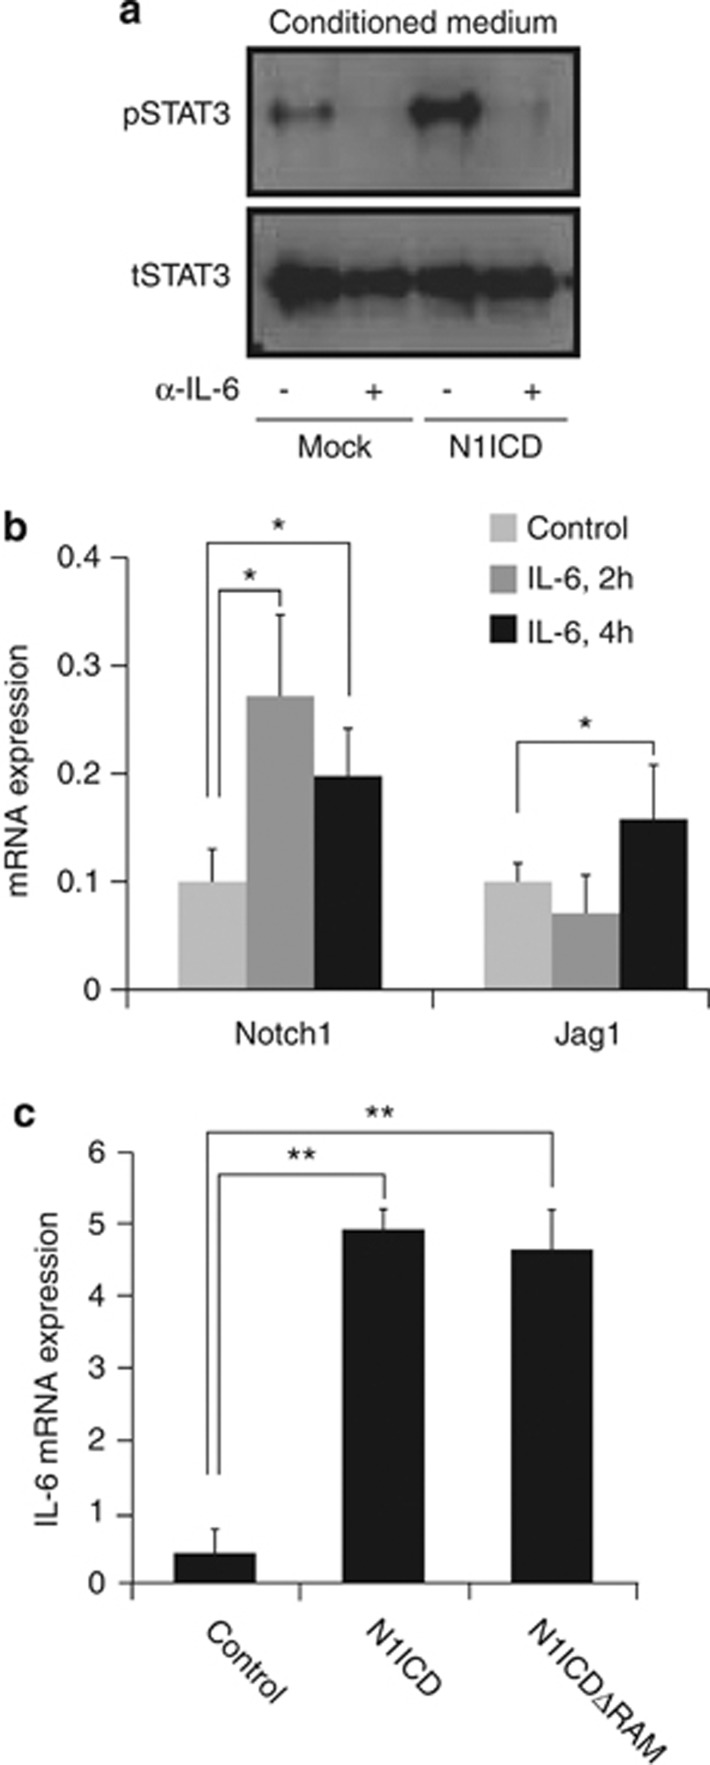
Notch signaling is frequently hyperactivated in breast cancer, but how the enhanced signaling contributes to the tumor process is less well understood. In this report, we identify the proinflammatory cytokine interleukin-6 (IL-6) as a novel Notch target in breast tumor cells. Enhanced Notch signaling upregulated IL-6 expression, leading to activation of autocrine and paracrine Janus kinase/signal transducers and activators of transcription signaling. IL-6 upregulation was mediated by non-canonical Notch signaling, as it could be effectuated by a cytoplasmically localized Notch intracellular domain and was independent of the DNA-binding protein CSL. Instead, Notch-mediated IL-6 upregulation was controlled by two proteins in the nuclear factor (NF)-κB signaling cascade, IKKα and IKKβ (inhibitor of nuclear factor kappa-B kinase subunit alpha and beta, respectively), as well as by p53. Activation of IL-6 by Notch required IKKα/IKKβ function, but interestingly, did not engage canonical NF-κB signaling, in contrast to IL-6 activation by inflammatory agents such as lipopolysaccharide. With regard to p53 status, IL-6 expression was upregulated by Notch when p53 was mutated or lost, and restoring wild-type p53 into p53-mutated or -deficient cells abrogated the IL-6 upregulation. Furthermore, Notch-induced transcriptomes from p53 wild-type and -mutated breast tumor cell lines differed extensively, and for a subset of genes upregulated by Notch in a p53-mutant cell line, this upregulation was reduced by wild-type p53. In conclusion, we identify IL-6 as a novel non-canonical Notch target gene, and reveal roles for p53 and IKKα/IKKβ in non-canonical Notch signaling in breast cancer and in the generation of cell context-dependent diversity in the Notch signaling output.


Figures

Figure 1
Figure 1
Notch signaling controls IL-6 expression. (a-d) Expression of Notch1 ICD in two basal (a, b) and two non-basal (c, d) breast cancers (data from 12 additional patients are shown in Supplementary Figure 1). Notch1 ICD expression (a1d1) was analyzed by immunohistochemistry for the N-terminus of Notch1 ICD generated following γ-secretase cleavage. Expression of CD44 (a2d2), estrogen receptor-α (ER; a3d3), progesterone receptor (PR; a4d4) and cytokeratin 5/6 (CK5/6; a5d5) was analyzed using previously described antibodies. (e) Expression levels of IL-6 in luminal and basal breast tumors (f, g) IL-6 mRNA expression measured by quantitative PCR (QPCR) in MDA-MB-231 cells (f) infected with adenoviral vectors expressing GFP, Notch1 ICD (N1ICD) or Notch3 ICD (N3ICD) or (g) cultured on immobilized Jagged1 or Dll4 ligands (Jag1-Fc and Dll4-Fc, respectively) or Fc fragments as control (Fc). In some of the experiments in g, the γ-secretase inhibitor DAPT was used to block Notch receptor proteolytic processing. (h) Analysis of effects of Notch activation on production of nascent versus mature IL-6 mRNA. Primer pairs were designed to capture nascent (pre-splicing) and mature (spliced) IL-6 mRNA (right), and the amount of nascent and mature IL-6 mRNA was analyzed by Q-PCR after culture on Fc-Jag1 or Fc (left). (i) Protein analysis by enzyme-linked immunosorbent assay (ELISA) from MDA-MB-231 cells transfected with Notch1 ICD or enhanced green fluorescent protein (EGFP) (control). (j, k) Correlation between IL-6 and Jagged1 mRNA data from luminal (j) and basal (k) breast cancer transcriptome data. (l) Expression of IL-6 mRNA in response to Notch (Notch1 ICD) activation in four basal and four luminal breast cancer cell lines. Values are significant at ***P<0.001, **P<0.01 and *P<0.05. r, correlation coefficient. Graphs represent average of three independent experiments.
Figure 2
Figure 2
Notch activates JAK/STAT signaling via upregulation of IL-6. (a) Addition of recombinant IL-6 to the cell culture medium of MDA-MB-231 cells (+ rec IL-6) led to elevated levels of pTyr705 STAT3 (phosphorylated STAT3 (pSTAT3)) but not total STAT3 (tSTAT3) protein. (b) Analysis of pSTAT3 (upper) and total STAT3 (lower) protein levels in MDA-MB-231 cells infected with adenoviral vectors expressing Notch1 ICD or enhanced green fluorescent protein (EGFP) (control) as indicated. In the two rightmost lanes, an IL-6 blocking antibody (α-IL-6) was added to the cell culture medium before Notch1 ICD or EGFP expression. (c, d) Analysis of (c) Bcl-xL protein levels in MDA-MB-231 cells infected with adenoviral vectors expressing Notch1 ICD or EGFP (control) or (d) in MDA-MB-231 cells supplemented with recombinant IL-6, and with phosphate-buffered saline (PBS) as control. (e) Analysis of paracrine IL-6 activation in MCF7 cells. Conditioned medium from MDA-MB-231 cells transfected with Notch1 ICD or EGFP (control). The conditioned medium was pre-treated with an IL-6 blocking antibody (α-IL-6) before supplemented to the MCF7 cells, and the levels of pSTAT3 and total STAT3 protein were analyzed.
Figure 3
Figure 3
Notch-mediated IL-6 upregulation is dependent on the cellular p53 status. (a) IL-6 mRNA expression was not significantly upregulated in MCF7 cells following infection with adenoviral vectors expressing Notch1 ICD (N1ICD) or enhanced green fluorescent protein (EGFP) (control). (b) Western blot analysis of p53 protein levels in MDA-MB-231 cells after transfection of empty pCMX vector (control) or wild-type p53 (wt p53). (c, d) IL-6 (c) and Hes1 (d) mRNA expression was analyzed following infection with adenoviral vectors expressing EGFP (control), Notch1 ICD or Notch3 ICD in MDA-MB-231 cells, combined with transfection of wt p53 or empty pCMX vector as control, as indicated. (e) p21 mRNA expression or p53-luciferase activation in MDA-MB-231 cells transfected with wt p53 or control plasmid (pCMX). (f) IL-6 mRNA expression analyzed in p53−/− mouse embryonic fibroblasts (MEFs) transfected with Notch1 ICD or EGFP plasmid and co-transfected with either wt p53 or empty pCMX vector, as indicated. (g) Analysis of IL-6 mRNA expression in MCF7 cells transfected with pCMX, Notch1 ICD or p53R248W (mut p53) co-transfected with Notch1 ICD plasmid, as indicated. (h) Comparison of IL-6 mRNA expression levels in breast tumors stratified according to p53 status (p53 wild-type versus p53 mutated/deficient, right bar) or ER status (ER+ or ER–, left bar). The median is shown as a horizontal line. Values are significant at ***P<0.001, **P<0.01 and *P<0.05, as indicated in the figure. Graphs represent averages of three independent experiments. n.s., not significant. RLU, relative luciferase units.
Figure 4
Figure 4
Notch regulates distinct gene sets in MDA-MB-231 and MCF7 cells. (a) A heat map (with triplicates) showing regulation of genes in MDA-MB-231 or MCF7 cells cultured on immobilized Jagged1 or Dll4 ligand or Fc fragment, as indicated. The γ-secretase inhibitor DAPT was added to block Notch signaling as indicated. Red=increased gene expression; green=reduced gene expression. (b) Principal component analysis of the data presented in a, as indicated. (ce) Quantitative PCR analysis of genes that were (c) upregulated in MCF7 but not in MDA-MB-231 cells; (d) upregulated in MDA-MB-231 but not MCF7 cells; and (e) the genes from d also following transfection of wild-type p53. Values are significant at ***P<0.001, **P<0.01 and *P<0.05, as indicated in the figure. Graphs represent averages of three independent experiments.
Figure 5
Figure 5
IL-6 expression is activated by non-canonical Notch signaling. (a, b) Analysis of IL-6 and Hey1 (a) or IL-6 and Hes1 (b) mRNA expression following transfection of empty pCMX vector (control), Notch1 ICD or Notch1 ICD combined with dnCSL (a) or pCMX, Notch1 ICD or Notch1 ICDΔRAM (b), as indicated. (c) Analysis of IL-6 and Nrarp mRNA expression following transfection of pCMX vector (control), NERT2 or NERT2 combined with tamoxifen (NERT2+TMX, 50 nM). (d) IL-6 mRNA expression following transfection of Hes1. (e, f) Correlation between IL-6 and Jagged1 (e) or IL-6 and Hes1 mRNA (f) data from the GeneSapiens transcriptome data from breast cancer. Values are significant at ***P<0.001, **P<0.01, as indicated in the figure. r, correlation coefficient. Graphs represent averages of three independent experiments.
Figure 6
Figure 6
Notch-mediated upregulation of IL-6 requires IKKα and IKKβ but not canonical NF-κB signaling. (a) Analysis of IL-6 mRNA expression following transfection of Notch1 ICD or enhanced green fluorescent protein (EGFP) (control), in various combinations with the IKKβ inhibitor TPCA1. (b, c) Analysis of IL-6 mRNA expression following small interfering RNA (siRNA) knockdown of IKKβ (b) or IKKα and IKKγ (c) mRNA expression. (d) Analysis of IKKα, β and γ mRNA levels after siRNA knockdown of the respective mRNA. (e) Analysis of IL-6 mRNA expression following transfection of IKKα or IKKβ expression constructs and co-transfection with Notch1 ICD or pCMX (control) plasmid. (f) Analysis of κB-luciferase activity following LPS or tumor necrosis factor alpha (TNFα) stimulation. (g) IL-6 promoter-luciferase activation in response to Notch1 ICD or EGFP (Control), in combination with LPS stimulation, as indicated. (h) Analysis of CSL, IL-6 and Hes1 mRNA expression in response to siRNA for CSL (CSL siRNA) or scrambled siRNA (Ctrl siRNA). (i, j) Analysis of κB-luciferase (i) or IL-6 promoter reporter (j) activity following LPS stimulation and after transfection of wild-type p53 or pCMX plasmid (control). (k) Analysis of Jagged1 and IL-6 mRNA expression following LPS stimulation. Values are significant at ***P<0.001, **P<0.01 and *P<0.05, as indicated in the figure. NS, not significant. RLU, relative luciferase units. Graphs represent averages of three independent experiments.
Figure 7
Figure 7
Reciprocal regulation of Notch and IL-6 in RAW264.7 cells. (a) Analysis of paracrine IL-6 activation in RAW264.7 cells. Conditioned medium from MDA-MB-231 cells transfected with Notch1 ICD (N1ICD) or enhanced green fluorescent protein (EGFP) (control) was pre-treated with an IL-6 blocking antibody (α-IL-6) before being supplemented to the RAW264.7 cells, and the levels of pTyr705 STAT3 (upper) and total STAT3 (lower) protein were analyzed. (b) Analysis of Notch1 and Jagged1 mRNA expression in response to IL-6 stimulation for 2 h and 4 h, as indicated. (c) Regulation of IL-6 mRNA expression by transfection of EGFP, Notch1 ICD or Notch1 ICDΔRAM in the RAW264.7 cells, as indicated. Values are significant at **P<0.01 and *P<0.05, as indicated in the figure. Graphs represent averages of three independent experiments.

References

    1. Robinson DR, Kalyana-Sundaram S, Wu Y-M, Shankar S, Cao X, Ateeq B, et al. Functionally recurrent rearrangements of the MAST kinase and Notch gene families in breast cancer. Nat Med. 2011;17:1646–1651. - PMC - PubMed
    1. Pece S, Serresi M, Santolini E, Capra M, Hulleman E, Galimberti V, et al. Loss of negative regulation by Numb over Notch is relevant to human breast carcinogenesis. J Cell Biol. 2004;167:215–221. - PMC - PubMed
    1. Stylianou S, Clarke RB, Brennan K. Aberrant activation of notch signaling in human breast cancer. Cancer Res. 2006;66:1517–1525. - PubMed
    1. Reedijk M, Odorcic S, Chang L, Zhang H, Miller N, McCready DR, et al. High-level coexpression of JAG1 and NOTCH1 is observed in human breast cancer and is associated with poor overall survival. Cancer Res. 2005;65:8530–8537. - PubMed
    1. Speiser J, Foreman K, Drinka E, Godellas C, Perez C, Salhadar A, et al. Notch-1 and Notch-4 biomarker expression in triple-negative breast cancer. Int J Surg Pathol. 2012;20:139–145. - PubMed

Publication types

MeSH terms

Associated data