

Stem cell expansion during carcinogenesis in stem cell-depleted conditional telomeric repeat factor 2 null mutant mice
- PMID: 23178498
- PMCID: PMC3910501
- DOI: 10.1038/onc.2012.555
Stem cell expansion during carcinogenesis in stem cell-depleted conditional telomeric repeat factor 2 null mutant mice
Abstract
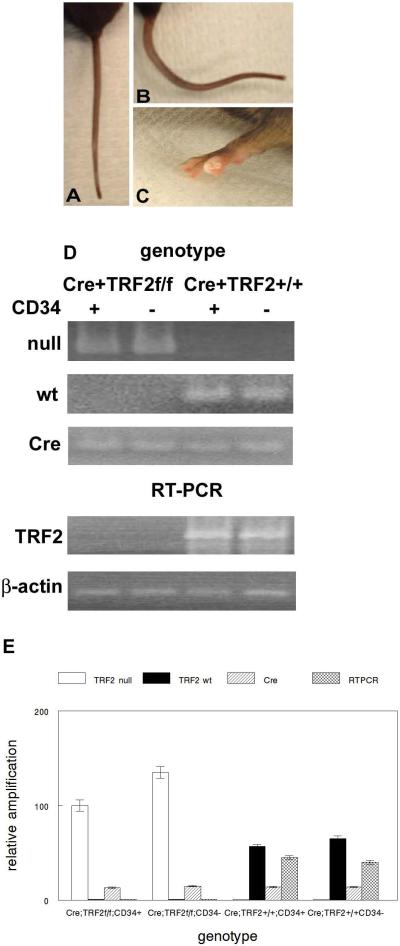
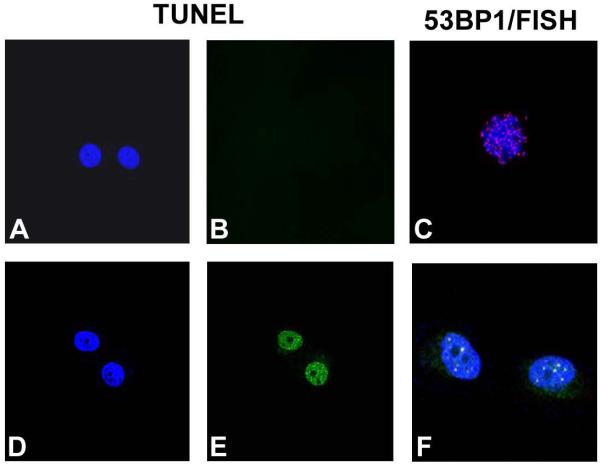
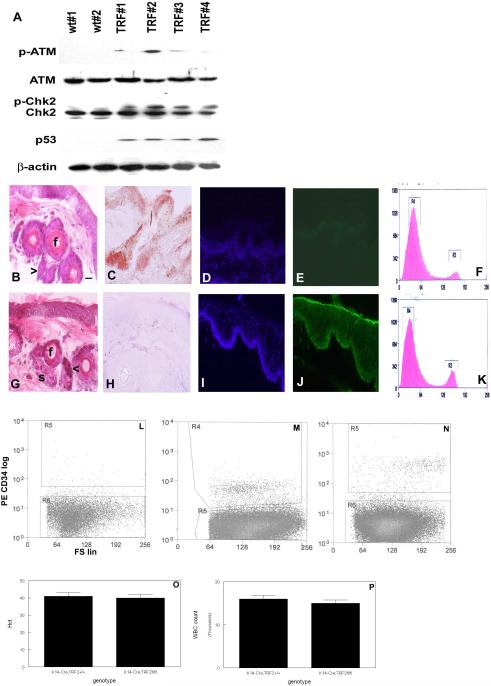
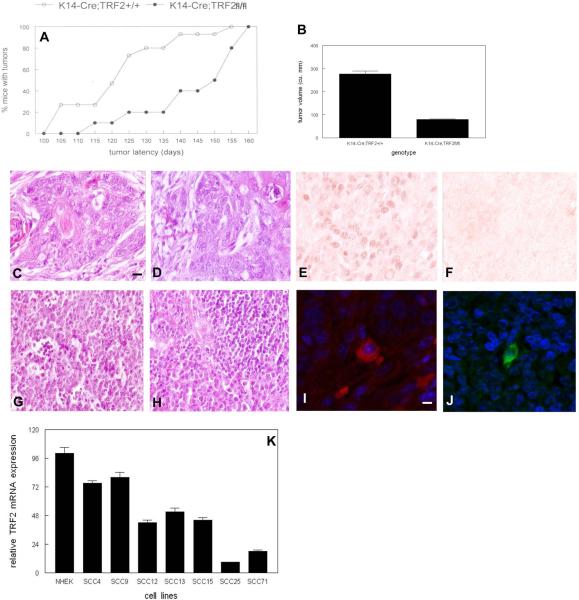
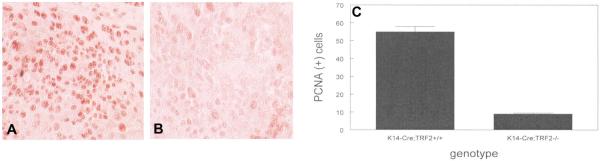
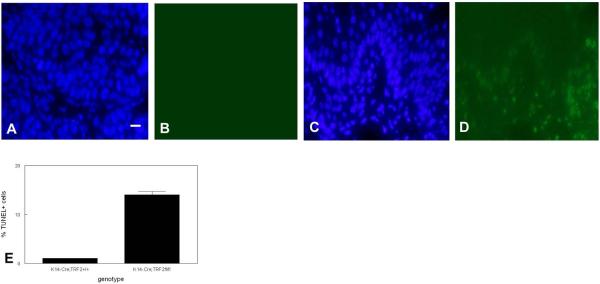
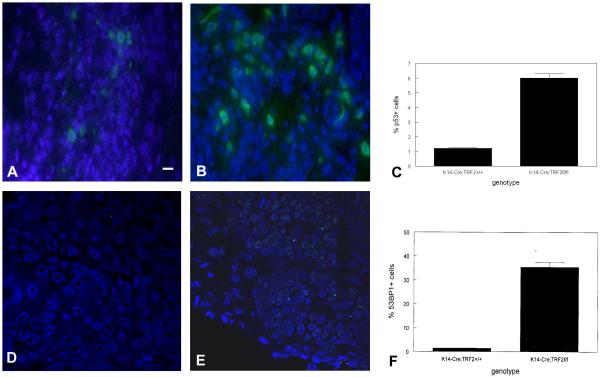
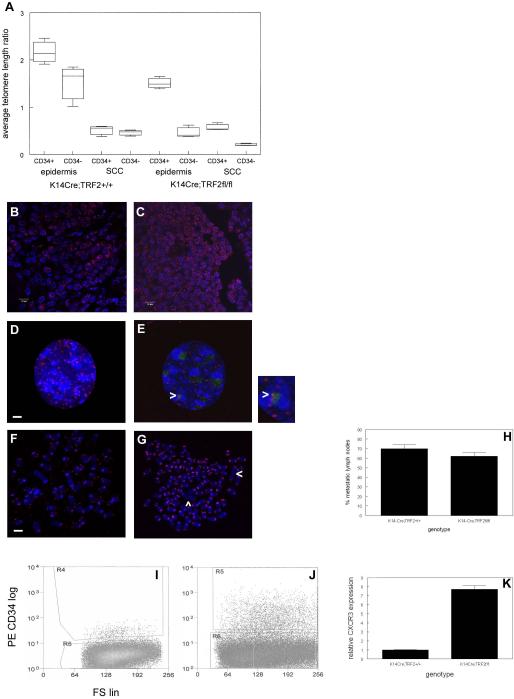
To examine the role of telomeric repeat-binding factor 2 (TRF2) in epithelial tumorigenesis, we characterized conditional loss of TRF2 expression in the basal layer of mouse epidermis. These mice exhibit some characteristics of dyskeratosis congenita, a human stem cell depletion syndrome caused by telomere dysfunction. The epidermis in conditional TRF2 null mice exhibited DNA damage response and apoptosis, which correlated with stem cell depletion. The stem cell population in conditional TRF2 null epidermis exhibited shorter telomeres than those in control mice. Squamous cell carcinomas induced in conditional TRF2 null mice developed with increased latency and slower growth due to reduced numbers of proliferating cells as the result of increased apoptosis. TRF2 null epidermal stem cells were found in both primary and metastatic tumors. Despite the low-grade phenotype of the conditional TRF2 null primary tumors, the number of metastatic lesions was similar to control cancers. Basal cells from TRF2 null tumors demonstrated extreme telomere shortening and dramatically increased numbers of telomeric signals by fluorescence in situ hybridization due to increased genomic instability and aneuploidy in these cancers. DNA damage response signals were detected at telomeres in TRF2 null tumor cells from these mice. The increased genomic instability in these tumors correlated with eightfold expansion of the transformed stem cell population compared with that in control cancers. We concluded that genomic instability resulting from loss of TRF2 expression provides biological advantages to the cancer stem cell population.
Figures
Similar articles
-
Elevated levels of TRF2 induce telomeric ultrafine anaphase bridges and rapid telomere deletions.Nat Commun. 2015 Dec 7;6:10132. doi: 10.1038/ncomms10132. Nat Commun. 2015. PMID: 26640040 Free PMC article.
-
Genetic dissection of the mechanisms underlying telomere-associated diseases: impact of the TRF2 telomeric protein on mouse epidermal stem cells.Dis Model Mech. 2009 Mar-Apr;2(3-4):139-56. doi: 10.1242/dmm.002121. Epub 2009 Feb 23. Dis Model Mech. 2009. PMID: 19259387 Free PMC article.
-
DNA processing is not required for ATM-mediated telomere damage response after TRF2 deletion.Nat Cell Biol. 2005 Jul;7(7):712-8. doi: 10.1038/ncb1275. Epub 2005 Jun 19. Nat Cell Biol. 2005. PMID: 15968270
-
Telomere Repeat-Binding Factor 2 Is Responsible for the Telomere Attachment to the Nuclear Membrane.Adv Protein Chem Struct Biol. 2015;101:67-96. doi: 10.1016/bs.apcsb.2015.06.009. Epub 2015 Oct 21. Adv Protein Chem Struct Biol. 2015. PMID: 26572976 Review.
-
Interstitial telomeric loops and implications of the interaction between TRF2 and lamin A/C.Differentiation. 2018 Jul-Aug;102:19-26. doi: 10.1016/j.diff.2018.06.001. Epub 2018 Jun 18. Differentiation. 2018. PMID: 29979997 Review.
Cited by
-
Involvement of Atm and Trp53 in neural cell loss due to Terf2 inactivation during mouse brain development.Histochem Cell Biol. 2017 Nov;148(5):489-501. doi: 10.1007/s00418-017-1591-3. Epub 2017 Jun 15. Histochem Cell Biol. 2017. PMID: 28620865 Free PMC article.
-
Abnormal function of telomere protein TRF2 induces cell mutation and the effects of environmental tumor‑promoting factors (Review).Oncol Rep. 2021 Aug;46(2):184. doi: 10.3892/or.2021.8135. Epub 2021 Jul 19. Oncol Rep. 2021. PMID: 34278498 Free PMC article. Review.
-
Telomere DNA damage signaling regulates cancer stem cell evolution, epithelial mesenchymal transition, and metastasis.Oncotarget. 2017 Sep 16;8(46):80139-80155. doi: 10.18632/oncotarget.20960. eCollection 2017 Oct 6. Oncotarget. 2017. PMID: 29113290 Free PMC article.
-
RETRACTED: SET1A Cooperates With CUDR to Promote Liver Cancer Growth and Hepatocyte-like Stem Cell Malignant Transformation Epigenetically.Mol Ther. 2016 Feb;24(2):261-275. doi: 10.1038/mt.2015.208. Epub 2015 Nov 19. Mol Ther. 2016. Retraction in: Mol Ther. 2023 May 3;31(5):1496. doi: 10.1016/j.ymthe.2023.03.016. PMID: 26581161 Free PMC article. Retracted.
-
HULC cooperates with MALAT1 to aggravate liver cancer stem cells growth through telomere repeat-binding factor 2.Sci Rep. 2016 Oct 26;6:36045. doi: 10.1038/srep36045. Sci Rep. 2016. PMID: 27782152 Free PMC article.
References
-
- de Lange T. Shelterin: the protein complex that shapes and safeguards human telomeres. Genes Dev. 2005;19:2100–2110. - PubMed
-
- van Steensel B, Smogorzewska A, de Lange T. TRF2 protects human telomeres from end to end fusions. Cell. 1998;92:401–413. - PubMed
-
- Karlseder J, Broccoli D, Dai Y, Hardy S, de Lange T. p53 and ATM dependent apoptosis induced by telomeres lacking TRF2. Science. 1999;283:1321–1324. - PubMed
-
- Denchi EL, de Lange T. Protection of telomeres through independent control of ATM and ATR by TRF2 and POT1. Nature. 2007;448:1068–1071. - PubMed
Publication types
MeSH terms
Substances
Grants and funding
LinkOut - more resources
Full Text Sources
Molecular Biology Databases
Research Materials
Miscellaneous
