

Improved in vivo diffusion tensor imaging of human cervical spinal cord
- PMID: 23178538
- PMCID: PMC3604900
- DOI: 10.1016/j.neuroimage.2012.11.014
Improved in vivo diffusion tensor imaging of human cervical spinal cord
Abstract
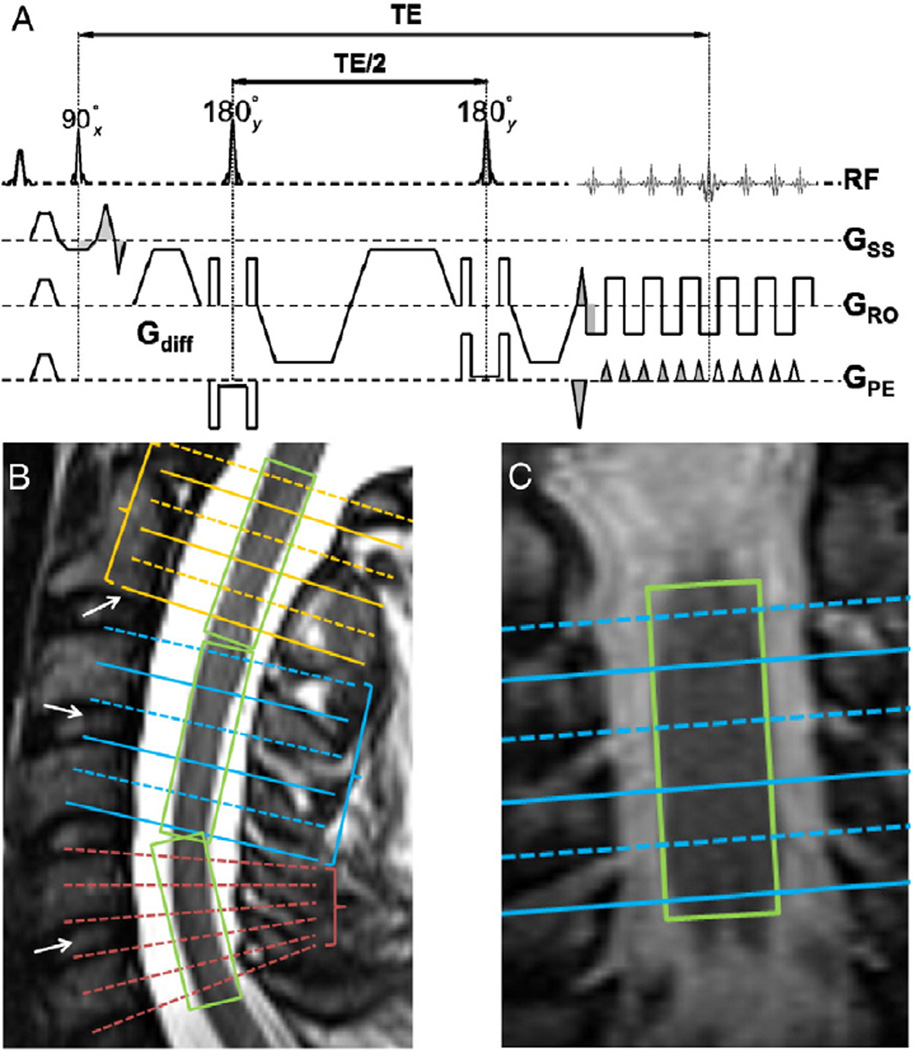
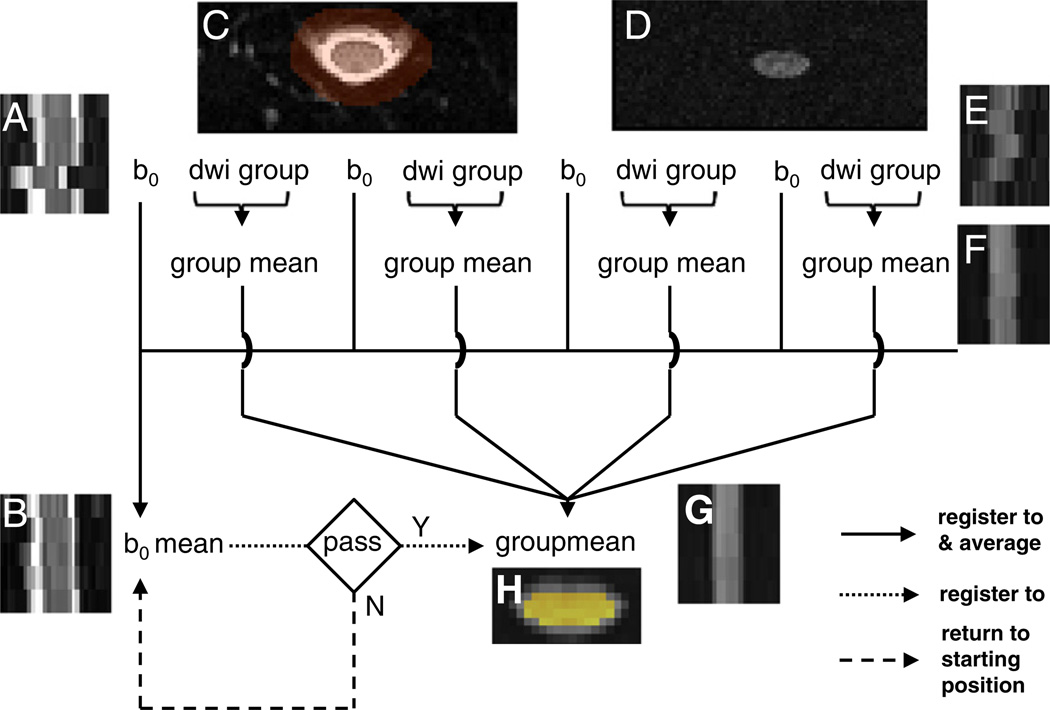
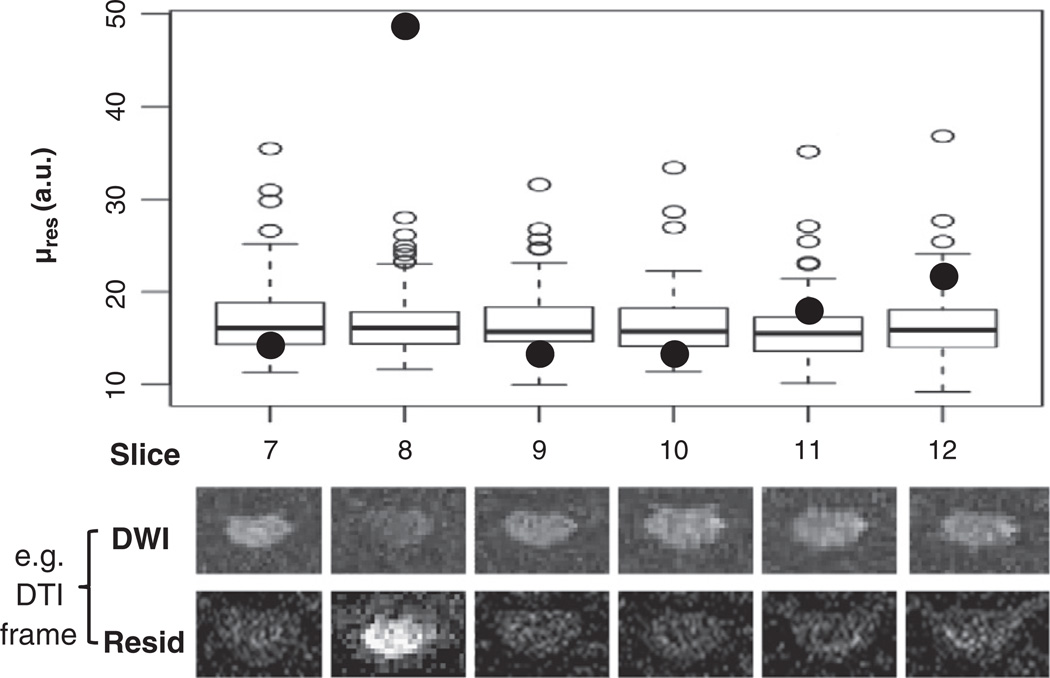
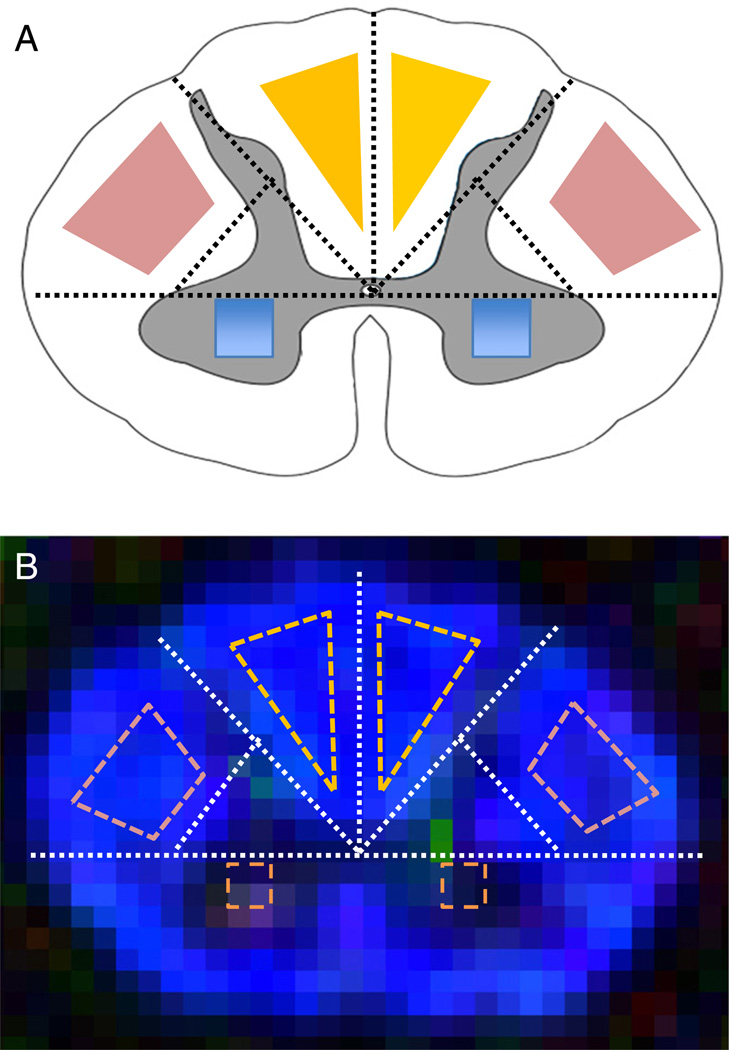
We describe a cardiac gated high in-plane resolution axial human cervical spinal cord diffusion tensor imaging (DTI) protocol. Multiple steps were taken to optimize both image acquisition and image processing. The former includes slice-by-slice cardiac triggering and individually tiltable slices. The latter includes (i) iterative 2D retrospective motion correction, (ii) image intensity outlier detection to minimize the influence of physiological noise, (iii) a non-linear DTI estimation procedure incorporating non-negative eigenvalue priors, and (iv) tract-specific region-of-interest (ROI) identification based on an objective geometry reference. Using these strategies in combination, radial diffusivity (λ(⊥)) was reproducibly measured in white matter (WM) tracts (adjusted mean [95% confidence interval]=0.25 [0.22, 0.29] μm(2)/ms), lower than previously reported λ(⊥) values in the in vivo human spinal cord DTI literature. Radial diffusivity and fractional anisotropy (FA) measured in WM varied from rostral to caudal as did mean translational motion, likely reflecting respiratory motion effect. Given the considerable sensitivity of DTI measurements to motion artifact, we believe outlier detection is indispensable in spinal cord diffusion imaging. We also recommend using a mixed-effects model to account for systematic measurement bias depending on cord segment.
Copyright © 2012 Elsevier Inc. All rights reserved.
Figures
Similar articles
-
Longitudinal assessment of white matter pathology in the injured mouse spinal cord through ultra-high field (16.4 T) in vivo diffusion tensor imaging.Neuroimage. 2013 Nov 15;82:574-85. doi: 10.1016/j.neuroimage.2013.06.019. Epub 2013 Jun 14. Neuroimage. 2013. PMID: 23770410
-
Diffusion tensor imaging of the cervical spinal cord in healthy adult population: normative values and measurement reproducibility at 3T MRI.Acta Radiol. 2014 May;55(4):478-85. doi: 10.1177/0284185113499752. Epub 2013 Aug 22. Acta Radiol. 2014. PMID: 23969263
-
Tract-specific and age-related variations of the spinal cord microstructure: a multi-parametric MRI study using diffusion tensor imaging (DTI) and inhomogeneous magnetization transfer (ihMT).NMR Biomed. 2016 Jun;29(6):817-32. doi: 10.1002/nbm.3530. Epub 2016 Apr 21. NMR Biomed. 2016. PMID: 27100385
-
An investigation of motion correction algorithms for pediatric spinal cord DTI in healthy subjects and patients with spinal cord injury.Magn Reson Imaging. 2014 Jun;32(5):433-9. doi: 10.1016/j.mri.2014.01.020. Epub 2014 Feb 5. Magn Reson Imaging. 2014. PMID: 24629515
-
The role of diffusion tensor imaging in the diagnosis, prognosis, and assessment of recovery and treatment of spinal cord injury: a systematic review.Neurosurg Focus. 2019 Mar 1;46(3):E7. doi: 10.3171/2019.1.FOCUS18591. Neurosurg Focus. 2019. PMID: 30835681
Cited by
-
Diffusion-weighted MRI of the spinal cord in cervical spondylotic myelopathy after instrumented fusion.Front Neurol. 2023 May 19;14:1172833. doi: 10.3389/fneur.2023.1172833. eCollection 2023. Front Neurol. 2023. PMID: 37273696 Free PMC article.
-
Changes in White Matter of the Cervical Spinal Cord after a Single Season of Collegiate Football.Neurotrauma Rep. 2021 Feb 17;2(1):84-93. doi: 10.1089/neur.2020.0035. eCollection 2021. Neurotrauma Rep. 2021. PMID: 34223548 Free PMC article.
-
Association between chronic stress-induced structural abnormalities in Ranvier nodes and reduced oligodendrocyte activity in major depression.Sci Rep. 2016 Mar 15;6:23084. doi: 10.1038/srep23084. Sci Rep. 2016. PMID: 26976207 Free PMC article.
-
Large-diameter compression arteries as a possible facilitating factor for trigeminal neuralgia: analysis of axial and radial diffusivity.Acta Neurochir (Wien). 2016 Mar;158(3):521-6. doi: 10.1007/s00701-015-2673-4. Epub 2016 Jan 6. Acta Neurochir (Wien). 2016. PMID: 26733127 Free PMC article.
-
Longitudinal study on diffusion tensor imaging and diffusion tensor tractography following spinal cord contusion injury in rats.Neuroradiology. 2016 Jun;58(6):607-614. doi: 10.1007/s00234-016-1660-7. Epub 2016 Mar 1. Neuroradiology. 2016. PMID: 26931783
References
-
- Agosta F, Laganà M, Valsasina P, Sala S, Dall'Occhio L, Sormani MP, Judica E, Filippi M. Evidence for cervical cord tissue disorganisation with aging by diffusion tensor MRI. Neuroimage. 2007;36:728–735. - PubMed
-
- Akselrod S, Gordon D, Ubel FA, Shannon DC, Berger AC, Cohen RJ. Power spectrum analysis of heart rate fluctuation: a quantitative probe of beat-to-beat cardiovascular control. Science. 1981;213:220–222. - PubMed
-
- Alperin N, Vikingstad EM, Gomez-Anson B, Levin DN. Hemodynamically independent analysis of cerebrospinal fluid and brain motion observed with dynamic phase contrast MRI. Magn. Reson. Med. 1996;35:741–754. - PubMed
-
- Andersson JLR. Maximum a posteriori estimation of diffusion tensor parameters using a Rician noise model: why, how and but. Neuroimage. 2008;42:1340–1356. - PubMed
-
- Arsigny V, Fillard P, Pennec X, Ayache N. Log-Euclidean metrics for fast and simple calculus on diffusion tensors. Magn. Reson. Med. 2006;56:411–421. - PubMed
Publication types
MeSH terms
Grants and funding
- K23 HD053212/HD/NICHD NIH HHS/United States
- P01 AG003991/AG/NIA NIH HHS/United States
- P01 AG026276/AG/NIA NIH HHS/United States
- UL1 TR000448/TR/NCATS NIH HHS/United States
- K23 NS052430/NS/NINDS NIH HHS/United States
- RR024992/RR/NCRR NIH HHS/United States
- P01 NS059560/NS/NINDS NIH HHS/United States
- P01NS059560/NS/NINDS NIH HHS/United States
- UL1RR024992/RR/NCRR NIH HHS/United States
- UL1 RR024992/RR/NCRR NIH HHS/United States
- C06 RR020092/RR/NCRR NIH HHS/United States
- CO6 RR020092/CO/NCI NIH HHS/United States
- R01 NS047592/NS/NINDS NIH HHS/United States
- R01NS047592/NS/NINDS NIH HHS/United States
- P30 NS048056/NS/NINDS NIH HHS/United States
LinkOut - more resources
Full Text Sources
Other Literature Sources
Medical
