. 2013 Mar;7(3):635-51.
doi: 10.1038/ismej.2012.133. Epub 2012 Nov 22.

Tackling the minority: sulfate-reducing bacteria in an archaea-dominated subsurface biofilm

Affiliations

Tackling the minority: sulfate-reducing bacteria in an archaea-dominated subsurface biofilm

Alexander J Probst et al. ISME J. 2013 Mar.

Abstract

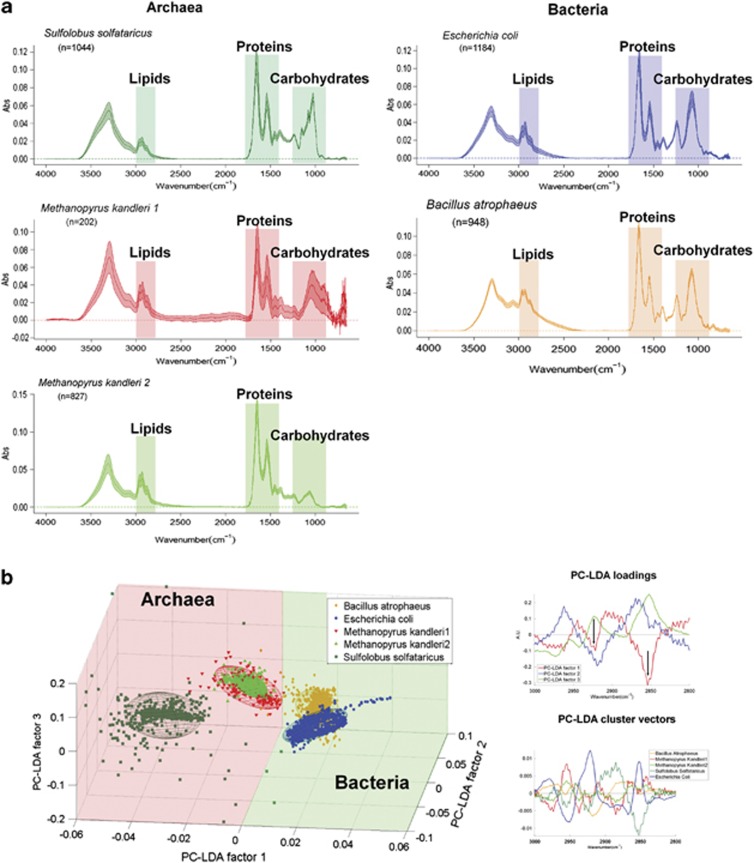
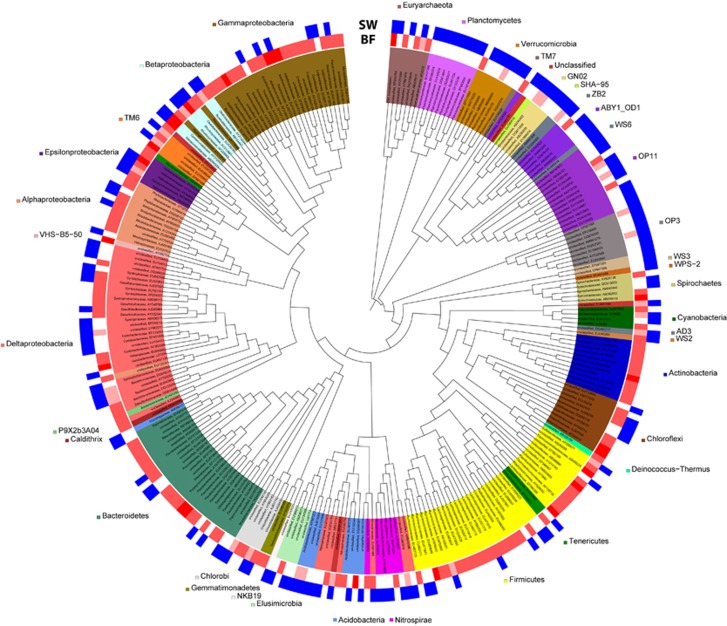
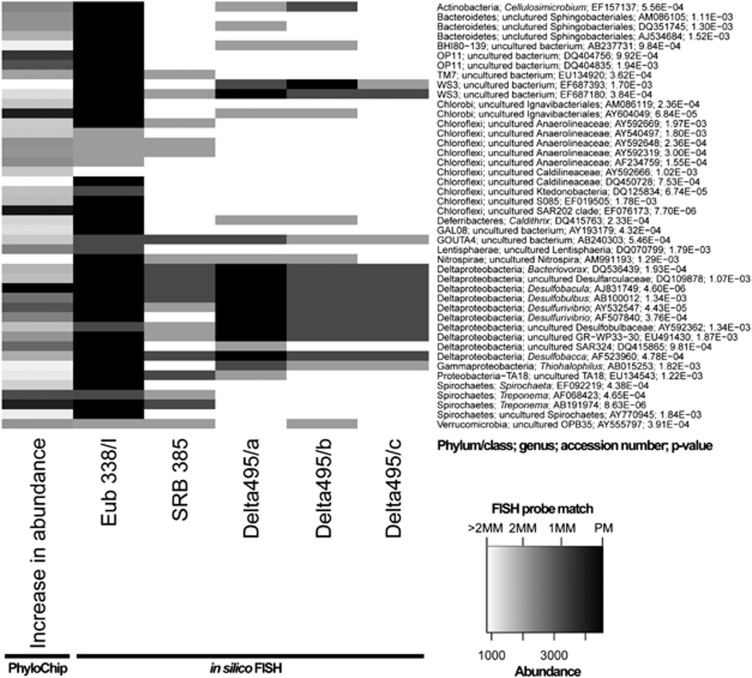
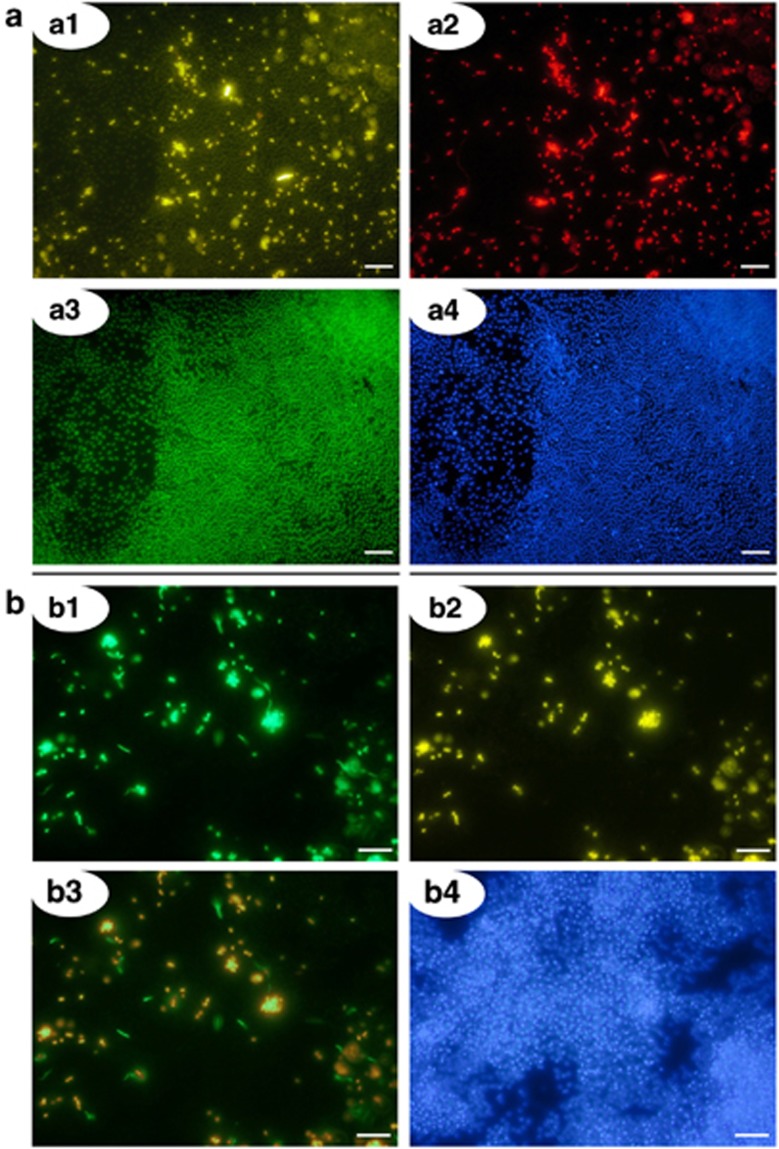
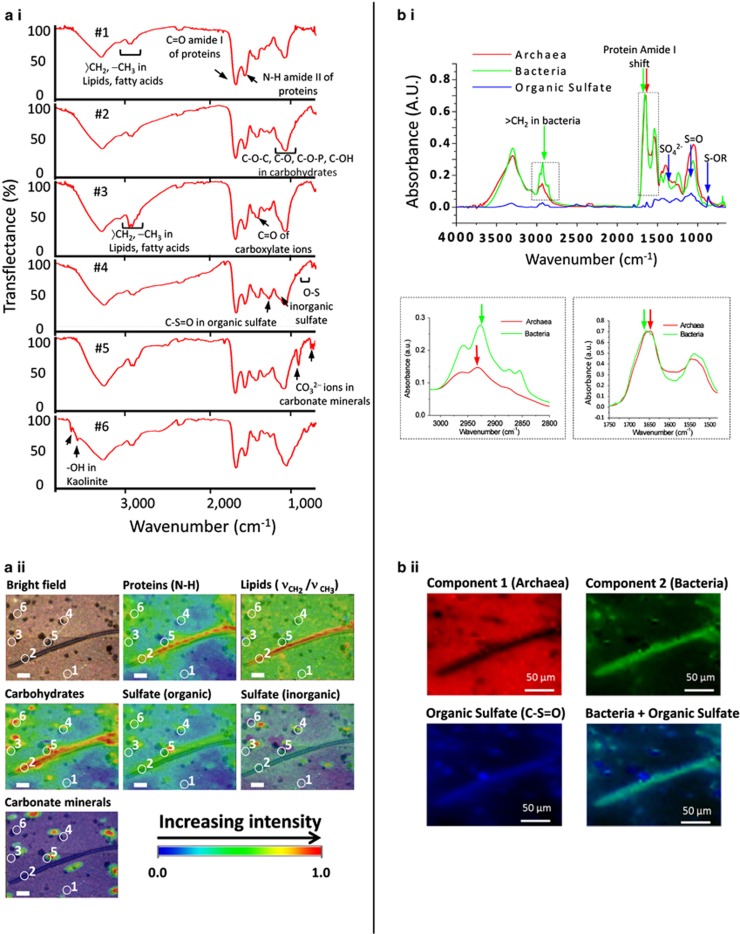
Archaea are usually minor components of a microbial community and dominated by a large and diverse bacterial population. In contrast, the SM1 Euryarchaeon dominates a sulfidic aquifer by forming subsurface biofilms that contain a very minor bacterial fraction (5%). These unique biofilms are delivered in high biomass to the spring outflow that provides an outstanding window to the subsurface. Despite previous attempts to understand its natural role, the metabolic capacities of the SM1 Euryarchaeon remain mysterious to date. In this study, we focused on the minor bacterial fraction in order to obtain insights into the ecological function of the biofilm. We link phylogenetic diversity information with the spatial distribution of chemical and metabolic compounds by combining three different state-of-the-art methods: PhyloChip G3 DNA microarray technology, fluorescence in situ hybridization (FISH) and synchrotron radiation-based Fourier transform infrared (SR-FTIR) spectromicroscopy. The results of PhyloChip and FISH technologies provide evidence for selective enrichment of sulfate-reducing bacteria, which was confirmed by the detection of bacterial dissimilatory sulfite reductase subunit B (dsrB) genes via quantitative PCR and sequence-based analyses. We further established a differentiation of archaeal and bacterial cells by SR-FTIR based on typical lipid and carbohydrate signatures, which demonstrated a co-localization of organic sulfate, carbonated mineral and bacterial signatures in the biofilm. All these results strongly indicate an involvement of the SM1 euryarchaeal biofilm in the global cycles of sulfur and carbon and support the hypothesis that sulfidic springs are important habitats for Earth's energy cycles. Moreover, these investigations of a bacterial minority in an Archaea-dominated environment are a remarkable example of the great power of combining highly sensitive microarrays with label-free infrared imaging.


Figures

Figure 1
Figure 1
SR-FTIR validation experiments: comparison of reference archaea and bacteria. (a) Comparison of SR-FTIR spectra of reference archaea and bacteria in the 4000–650 cm−1 region reflecting individual membrane lipids and cell envelope compositional characteristics (see Materials and methods section). All spectra are mean±standard deviation (colored area). Archaea: S. solfataricus (glycosilated surface layer); M. kandleri (pseudopeptidoglycan and proteinaceous sheath; please note, M. kandleri exhibits two types of spectra, depending on the observed accumulation of extracellular material (type 1: with extracellular material, type 2: without extracellular material)). Bacteria: E. coli (Gram-negative cell wall), B. atrophaeus (Gram-positive cell wall). The numbers of reference spectra per species measured are given (n). (b) PC-LDA of the same spectra in the CH vibration region (3000–2800 cm−1). Left: three-dimensional PC-LDA score plots reveal an excellent separation of archaea and bacteria along the first PC-LDA factor; each ellipse covers an area of 95% confidence level. The three components explain 92.7% of the variance. Right: The first PC-LDA loading spectrum has two distinct peaks at 2920 cm−1 and 2850 cm−1 (see arrows), which are associated with CH2 bond stretching. The corresponding cluster vector spectra reveal more specific membrane lipids composition and organization variations among the reference strains.
Figure 2
Figure 2
Difference in microbial richness between the spring water and the biofilm: presence and absence of subfamilies in spring water (SW) and biofilm samples (BF). Color intensities (red) of the biofilm samples reflect the number of times the subfamily was called present in one of the three replicates. As the SW sample was not replicated, heatmap reflects presence (blue label) or absence only. The Neighbor Joining tree was constructed with one representative OTU per subfamily (branch length is ignored). Leaf IDs give the classification on family level and the accession number of the representative OTU. Only those subfamilies that occurred in the water sample or in at least 2/3 of the biofilm replicates are shown.
Figure 3
Figure 3
Significantly enriched OTUs (one representative of each subfamily) in the SM1 Euryarchaeon biofilm and in silico FISH-probe match. Heatmap of OTUs that increased highly significantly (P<0.002) in biofilm compared with string-of-pearls community samples and were called present in at least one of the samples (first column). Probes used for FISH experiments in this study were in silico matched to representative sequences of the enriched OTUs using the ARB software package. The theoretical coverage of the FISH probes is displayed in columns 2−5; the decreasing heatmap intensity reflects the number of mismatches of each probe per OTU (MM=mismatch, PM=perfect match).
Figure 4
Figure 4
(a) Ternary FISH analysis of the subsurface biofilm with SRB-, Bacteria and Archaea-specific probes. Analysis reveals a dominance of archaeal cocci (SM1 Euryarchaeon) and of SRB-385-stained bacteria in the bacterial minority: ∼85% of the detected Bacteria revealed a signal with the sulfate-reducer specific probe. Scale bars=10 μm. a1: biofilm, FISH-stained with probe SRB385 CY3 (targeting SRB, yellow). a2: same detail, stained with probe EUB 338/I Texas Red (targeting Bacteria, red). a3: same detail, stained with probe mixture ArchMix RG (targeting Archaea, green). a4: same detail, reference-stained with DAPI (blue). (b) biofilm sample FISH-stained with SRB-directed Delta495 probe mix. The overwhelming majority of bacteria in the biofilm showed signals with the Delta495 probe mix (89.2%). Scale bars=10 μm. b1: probe 338/I RG (targeting Bacteria, green). b2: same detail, stained with probe mix Delta495 (targeting SRB, yellow). b3: overlay of details 1 and 2. b4: same detail, reference-stained with DAPI (blue).
Figure 5
Figure 5
(a) SR-FTIR images of Bacteria in the Archaea-dominated biofilm. SR-FTIR images (220 μm by 180 μm) showing the distribution of microorganisms and biogeochemical products in an Archaea-dominated biofilm. (a i and a ii) Distribution heatmap (from univariate analysis) of the relative abundance of total proteins (based on the peak area centered at ∼1548 cm−1), of bacterial lipids (the ratio of the peak area of CH2 centered at ∼2852 cm−1 to the peak area of CH3 at ∼2872 cm−1), carbohydrates (the peak area centered at ∼1089 cm−1), sulfur/carbon biochemical cycling products (S=O from organic sulfate products, centered at ∼1240 cm−1, S=O of inorganic sulfate centered at ∼1130 cm−1 and CO32− groups of carbonate minerals in the 880–840 cm−1 region. The OH of clay centered at ∼3695 cm−1 is not shown here). The white circles with numbers (1–6) in the bright field and in the SR-FTIR images (a ii) correspond to the transflectance spectra (a i). The circles represent pixels where the spectra were recorded. Note: Filamentous bacterial structures in the biofilm were rarely observed but specifically presented here in order to illustrate the lipid signatures of Bacteria and Archaea (for more samples please see Supplementary Figure S9). Scale bars=25 μm. (b) Multivariate curve resolution analysis to differentiate Archaea and Bacteria. (b i) Spectra of the three components extracted from the MCR, in red component 1 (Archaea), in green component 2 (Bacteria), in blue component presenting sulfate spectral features, with arrows pinpointing the spectral markers used in the analysis, in the panels below highlighted the spectral region of lipids, important region for the distinction of Bacteria and Archaea since their different membrane composition, and protein region where a shift is observable in Amide I band, index of a different protein content in Bacteria and Archaea. (b ii): Relative concentration images (220 μm by 180 μm) of Archaea (component 1) and Bacteria (component 2) recovered by the MCR analysis and the chemical distribution maps of organic sulfate (C-S=O) in blue. Merging the relative bacterial concentration image (in green color) with the organic sulfate distribution map (in blue) reveals the co-localization of bacteria and organic sulfate. Scale bars=50 μm.

References

    1. Adler HH, Kerr PF. Variations in infrared spectra, molecular symmetry and site symmetry of sulfate minerals. Am Mineralogist. 1965;50:132–147.
    1. Altschul SF, Gish W, Miller W, Myers EW, Lipman DJ. Basic local alignment search tool. J Mol Biol. 1990;215:403–410. - PubMed
    1. Amann RI, Binder BJ, Olson RJ, Chisholm SW, Devereux R, Stahl DA. Combination of 16S rRNA-targeted oligonucleotide probes with flow cytometry for analyzing mixed microbial populations. Appl Environ Microbiol. 1990a;56:1919–1925. - PMC - PubMed
    1. Amann RI, Krumholz L, Stahl DA. Fluorescent-oligonucleotide probing of whole cells for determinative, phylogenetic, and environmental studies in microbiology. J Bacteriol. 1990b;172:762–770. - PMC - PubMed
    1. Ashelford KE, Chuzhanova NA, Fry JC, Jones AJ, Weightman AJ. At least 1 in 20 16S rRNA sequence records currently held in public repositories is estimated to contain substantial anomalies. Appl Environ Microbiol. 2005;71:7724–7736. - PMC - PubMed

Publication types