

Multi-scale structure and geographic drivers of cross-infection within marine bacteria and phages
- PMID: 23178671
- PMCID: PMC3578562
- DOI: 10.1038/ismej.2012.135
Multi-scale structure and geographic drivers of cross-infection within marine bacteria and phages
Abstract
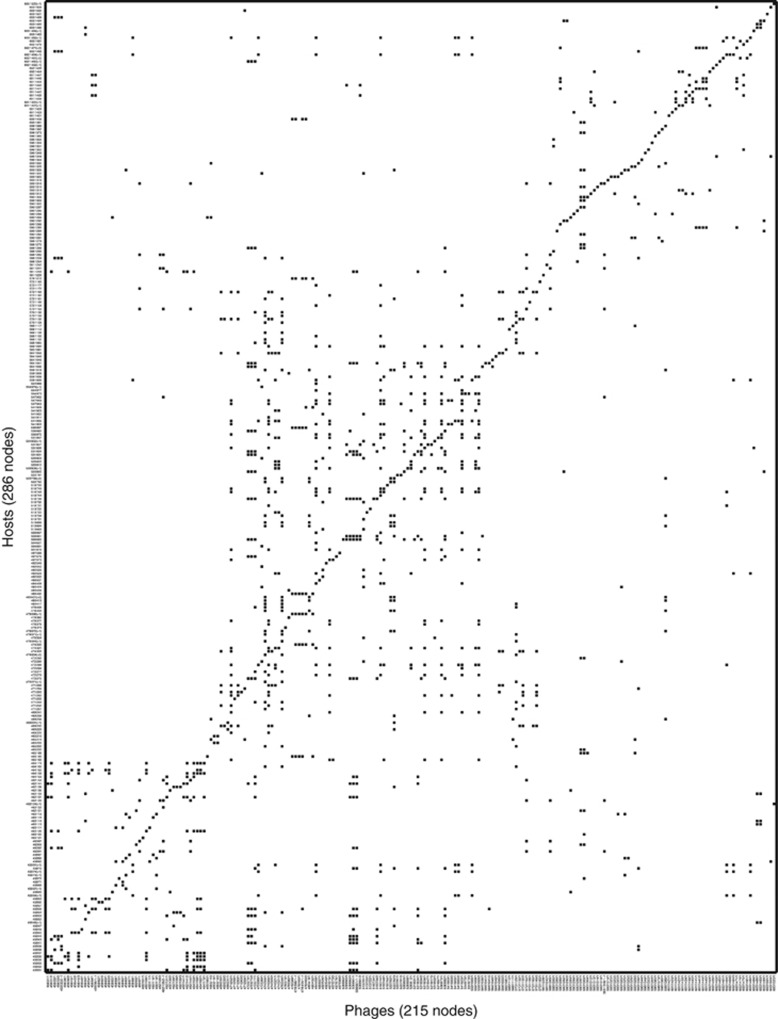
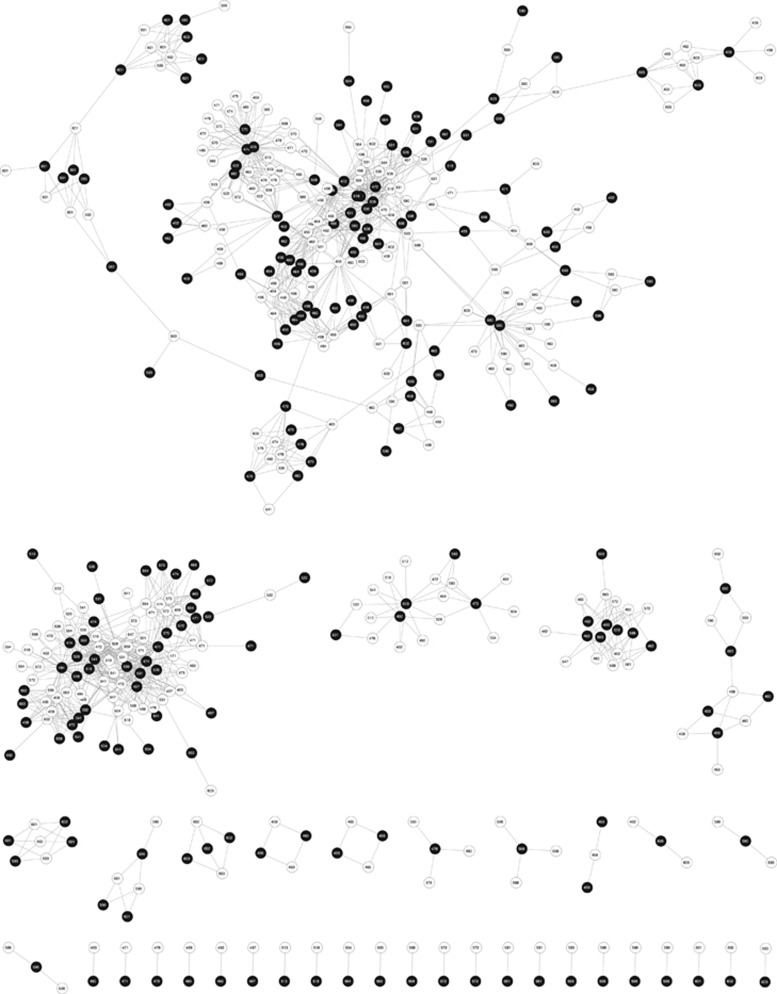
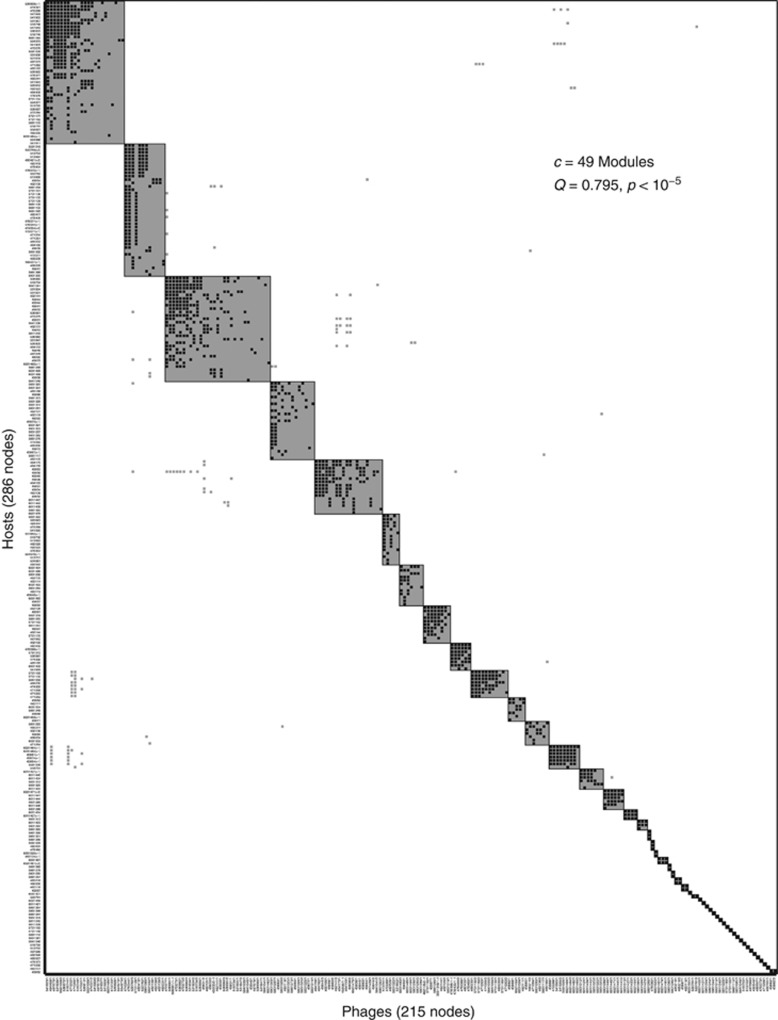
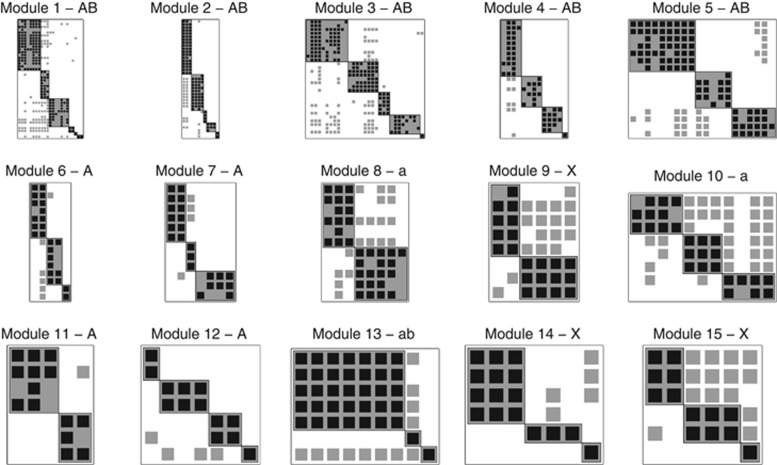
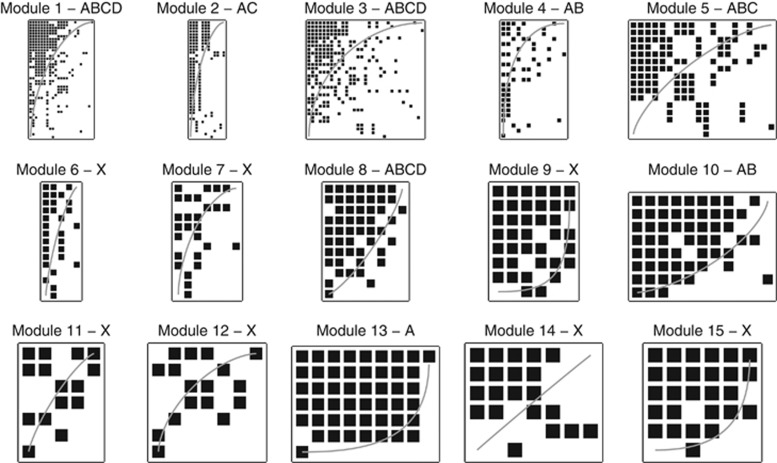
Bacteriophages are the most abundant biological life forms on Earth. However, relatively little is known regarding which bacteriophages infect and exploit which bacteria. A recent meta-analysis showed that empirically measured phage-bacteria infection networks are often significantly nested, on average, and not modular. A perfectly nested network is one in which phages can be ordered from specialist to generalist such that the host range of a given phage is a subset of the host range of the subsequent phage in the ordering. The same meta-analysis hypothesized that modularity, in which groups of phages specialize on distinct groups of hosts, should emerge at larger geographic and/or taxonomic scales. In this paper, we evaluate the largest known phage-bacteria interaction data set, representing the interaction of 215 phage types with 286 host types sampled from geographically separated sites in the Atlantic Ocean. We find that this interaction network is highly modular. In addition, some of the modules identified in this data set are nested or contain submodules, indicating the presence of multi-scale structure, as hypothesized in the earlier meta-analysis. We examine the role of geography in driving these patterns and find evidence that the host range of phages and the phage permissibility of bacteria is driven, in part, by geographic separation. We conclude by discussing approaches to disentangle the roles of ecology and evolution in driving complex patterns of interaction between phages and bacteria.
Figures

References
-
- Agrawal A, Lively CM. Infection genetics: gene-for-gene versus matching-alleles models and all points in between. Evol Ecol Res. 2002;4:79–90.
-
- Almeida-Neto M, Guimarães P, Guimarães PR, Loyola RD, Ulrich W. A consistent metric for nestedness analysis in ecological systems: reconciling concept and measurement. Oikos. 2008;117:1227–1239.
-
- Andersson AF, Banfield JF. Virus population dynamics and acquired virus resistance in natural microbial communities. Science. 2008;320:1047–1050. - PubMed
-
- Atmar W, Patterson BD. The measure of order and disorder in the distribution of species in fragmented habitat. Oecologia. 1993;96:373–382. - PubMed
