. 2013 May;7(5):1038-50.
doi: 10.1038/ismej.2012.139. Epub 2012 Nov 22.

Contemporary environmental variation determines microbial diversity patterns in acid mine drainage

Affiliations

Contemporary environmental variation determines microbial diversity patterns in acid mine drainage

Jia-Liang Kuang et al. ISME J. 2013 May.

Abstract

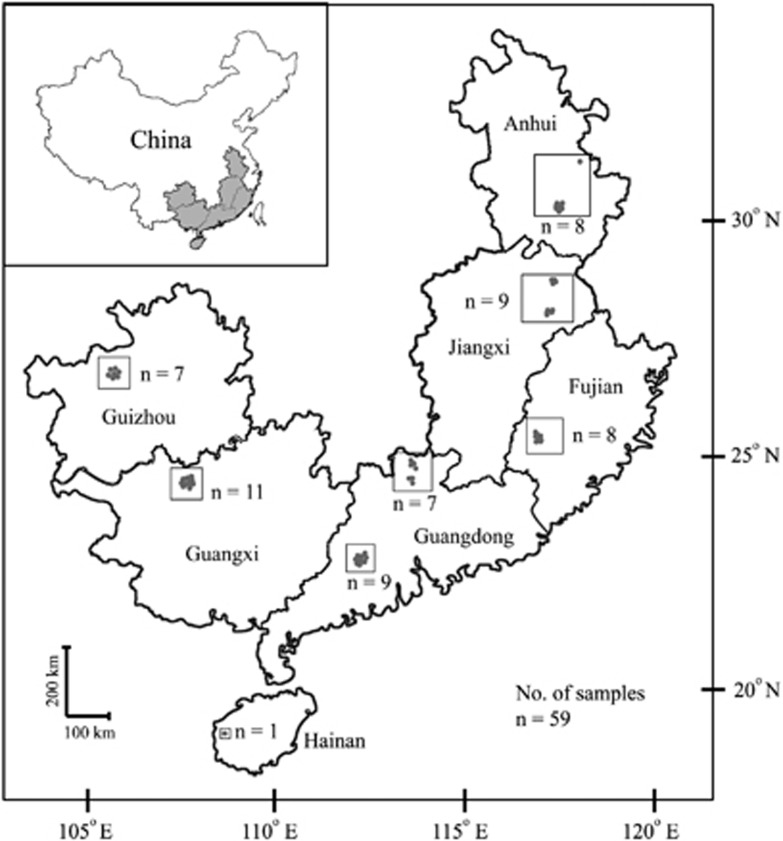
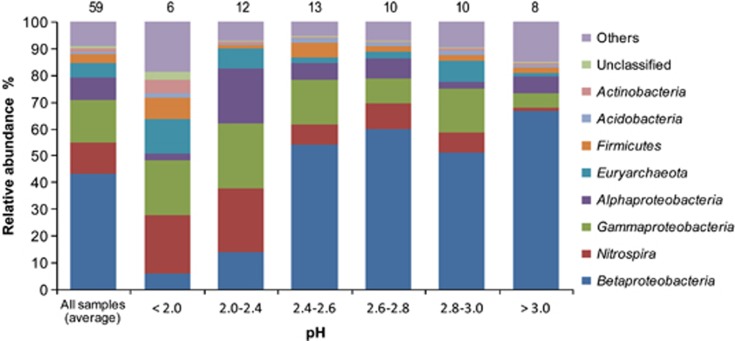
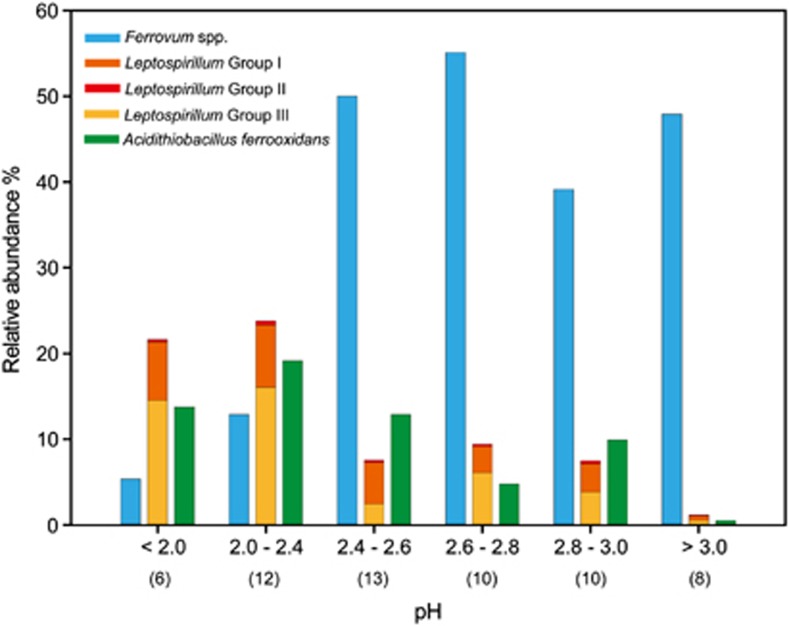
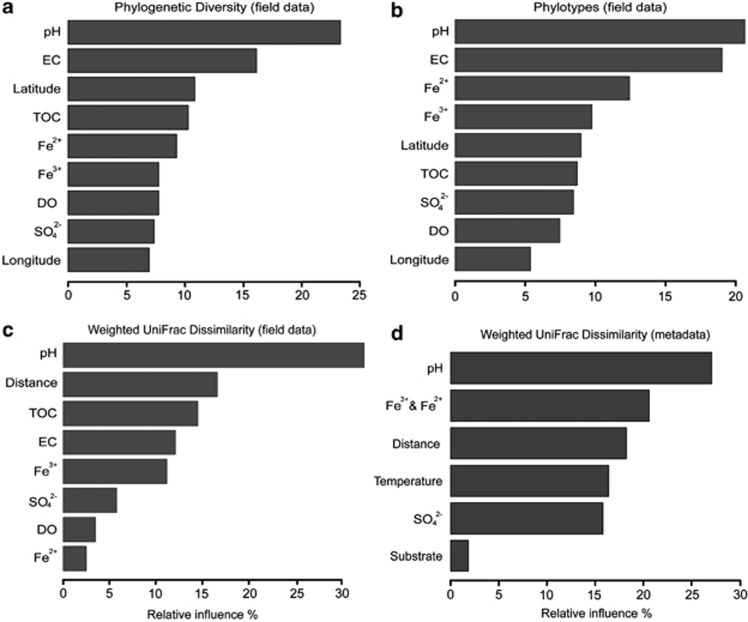
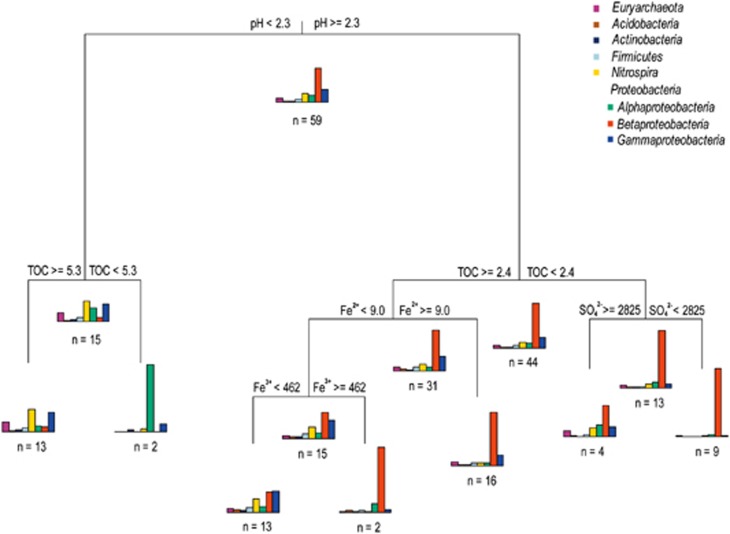
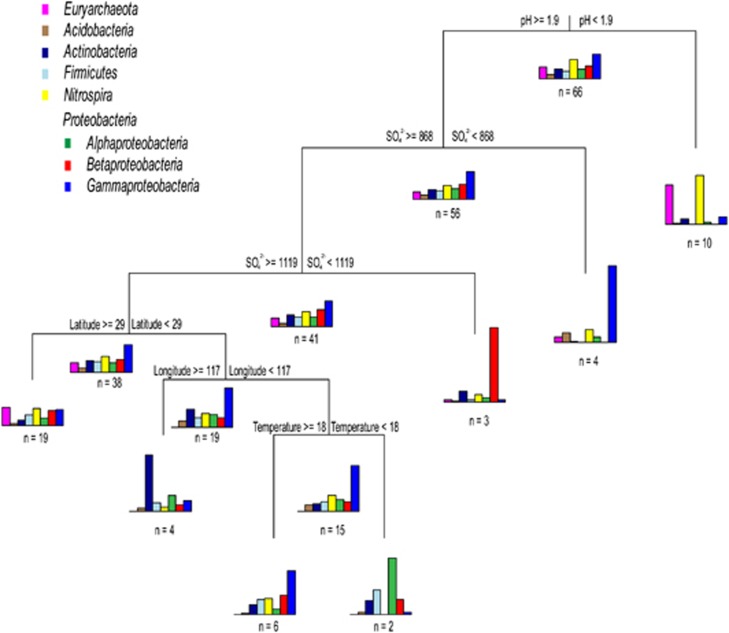
A wide array of microorganisms survive and thrive in extreme environments. However, we know little about the patterns of, and controls over, their large-scale ecological distribution. To this end, we have applied a bar-coded 16S rRNA pyrosequencing technology to explore the phylogenetic differentiation among 59 microbial communities from physically and geochemically diverse acid mine drainage (AMD) sites across Southeast China, revealing for the first time environmental variation as the major factor explaining community differences in these harsh environments. Our data showed that overall microbial diversity estimates, including phylogenetic diversity, phylotype richness and pairwise UniFrac distance, were largely correlated with pH conditions. Furthermore, multivariate regression tree analysis also identified solution pH as a strong predictor of relative lineage abundance. Betaproteobacteria, mostly affiliated with the 'Ferrovum' genus, were explicitly predominant in assemblages under moderate pH conditions, whereas Alphaproteobacteria, Euryarchaeota, Gammaproteobacteria and Nitrospira exhibited a strong adaptation to more acidic environments. Strikingly, such pH-dependent patterns could also be observed in a subsequent comprehensive analysis of the environmental distribution of acidophilic microorganisms based on 16S rRNA gene sequences previously retrieved from globally distributed AMD and associated environments, regardless of the long-distance isolation and the distinct substrate types. Collectively, our results suggest that microbial diversity patterns are better predicted by contemporary environmental variation rather than geographical distance in extreme AMD systems.


Figures

Figure 1
Figure 1
Location of sampling sites of AMD across Southeast China. Detailed site characteristics are listed in Supplementary Tables 1 and 2.
Figure 2
Figure 2
Relative abundances (%) of dominant lineages (phylum level) in overall communities and in different groups of AMD samples along the gradient of pH levels. The numbers above the columns indicate the number of samples in each group. Others include 12 phyla: Bacteroidetes, Chlamydiae, Chloroflexi, Crenarchaeota, Cyanobacteria, Deinococcus-Thermus, Gemmatimonadetes, OD1, OP11, Planctomycetes, TM7 and Verrucomicrobia; and two subphyla for Proteobacteria: Deltaproteobacteria and Epsilonproteobacteria.
Figure 3
Figure 3
Relative abundances of Ferrovum spp., Leptospirillum groups and A. ferrooxidans in different groups of microbial assemblages along the gradient of pH levels in AMD. The numbers within the parentheses indicate the number of samples in each group.
Figure 4
Figure 4
Relative influence (%) of environmental properties and spatial distance for phylogenetic diversity (a), phylotypes (b), weighted UniFrac dissimilarity of field data (pyrosequecing) (c) and weighted UniFrac dissimilarity of metadata (meta-analysis) (d) evaluated by ABT models.
Figure 5
Figure 5
Multivariate regression tree analysis of the relation between relative abundance of dominant lineages and environmental parameters in microbial communities of AMD. The bar plots show the mean relative abundance of specific lineages at each terminal nodes and the distribution patterns of relative abundance represent the dynamics of community composition among each split. The numbers under the bar plots indicate the number (n) of samples within each group. All values are in mg l−1, except pH, which is in standard units.
Figure 6
Figure 6
Multivariate regression tree analysis of the relation between relative abundance of dominant lineages and environmental parameters in microbial communities of global AMD and associated systems using metadata. pH, latitude and longitude are in standard units. Temperature is in °C and sulfate concentration is in mg l−1.

References

    1. Amaral-Zettler LA, Zettler ER, Theroux SM, Palacios C, Aguilera A, Amils R. Microbial community structure across the tree of life in the extreme Rio Tinto. ISME J. 2011;5:42–50. - PMC - PubMed
    1. Auguet JC, Barberan A, Casamayor EO. Global ecological patterns in uncultured Archaea. ISME J. 2010;4:182–190. - PubMed
    1. Baker BJ, Banfield JF. Microbial communities in acid mine drainage. FEMS Microbiol Ecol. 2003;44:139–152. - PubMed
    1. Bates ST, Berg-Lyons D, Caporaso JG, Walters WA, Knight R, Fierer N. Examining the global distribution of dominant archaeal populations in soil. ISME J. 2011;5:908–917. - PMC - PubMed
    1. Belnap CP, Pan C, Denef VJ, Samatova NF, Hettich RL, Banfield JF. Quantitative proteomic analyses of the response of acidophilic microbial communities to different pH conditions. ISME J. 2011;5:1152–1161. - PMC - PubMed

Publication types

Substances