. 2013 Jan;16(1):89-97.
doi: 10.1038/nn.3267. Epub 2012 Nov 25.

Choice-related activity and correlated noise in subcortical vestibular neurons

Affiliations

Choice-related activity and correlated noise in subcortical vestibular neurons

Sheng Liu et al. Nat Neurosci. 2013 Jan.

Abstract

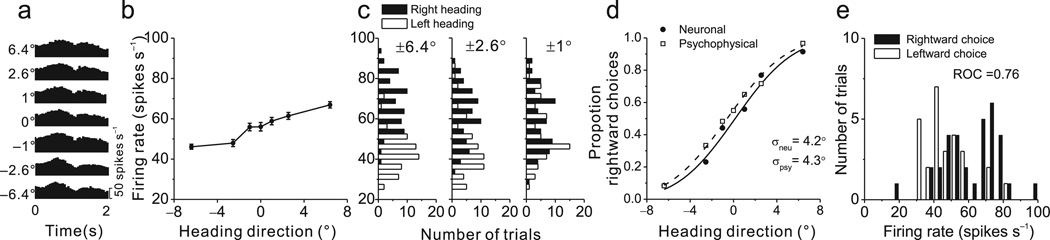
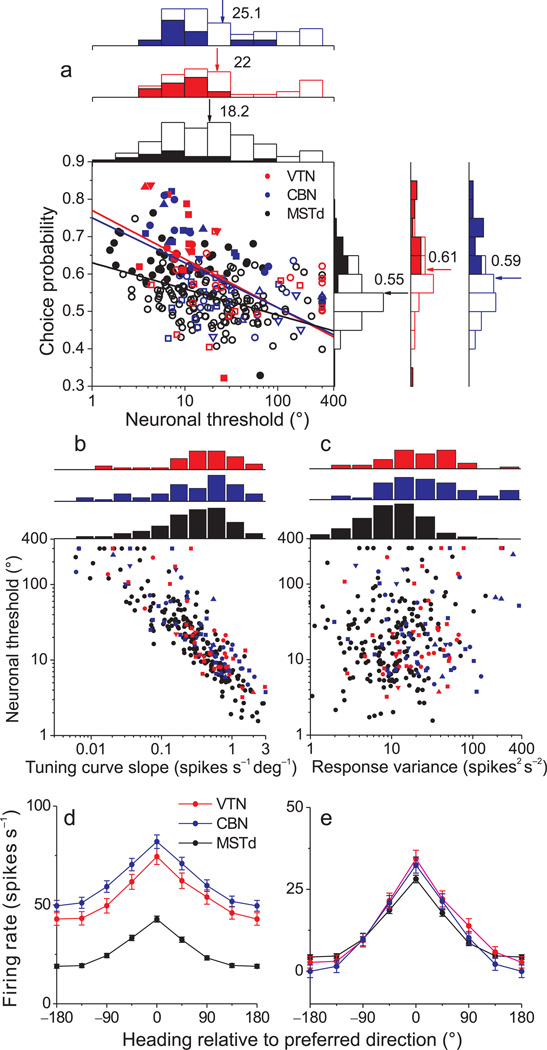
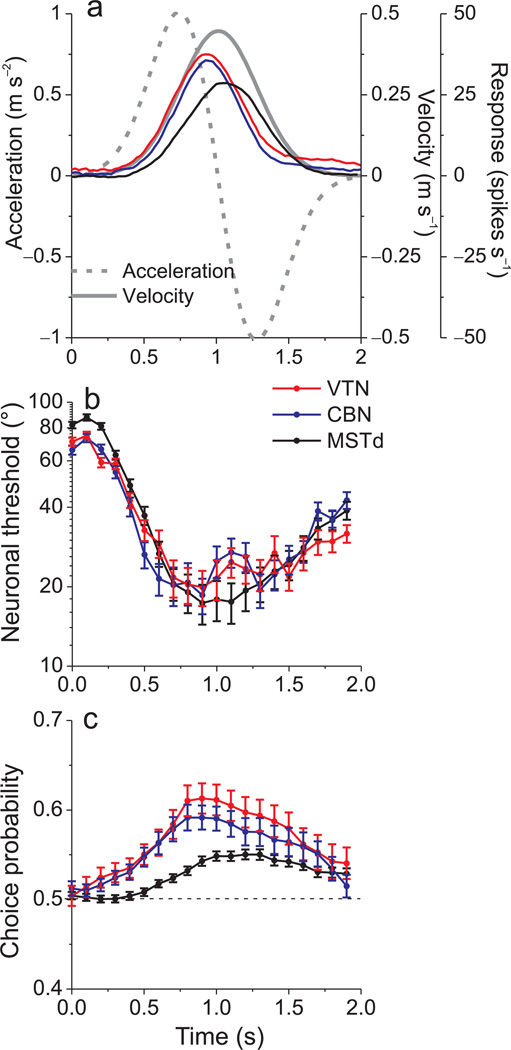
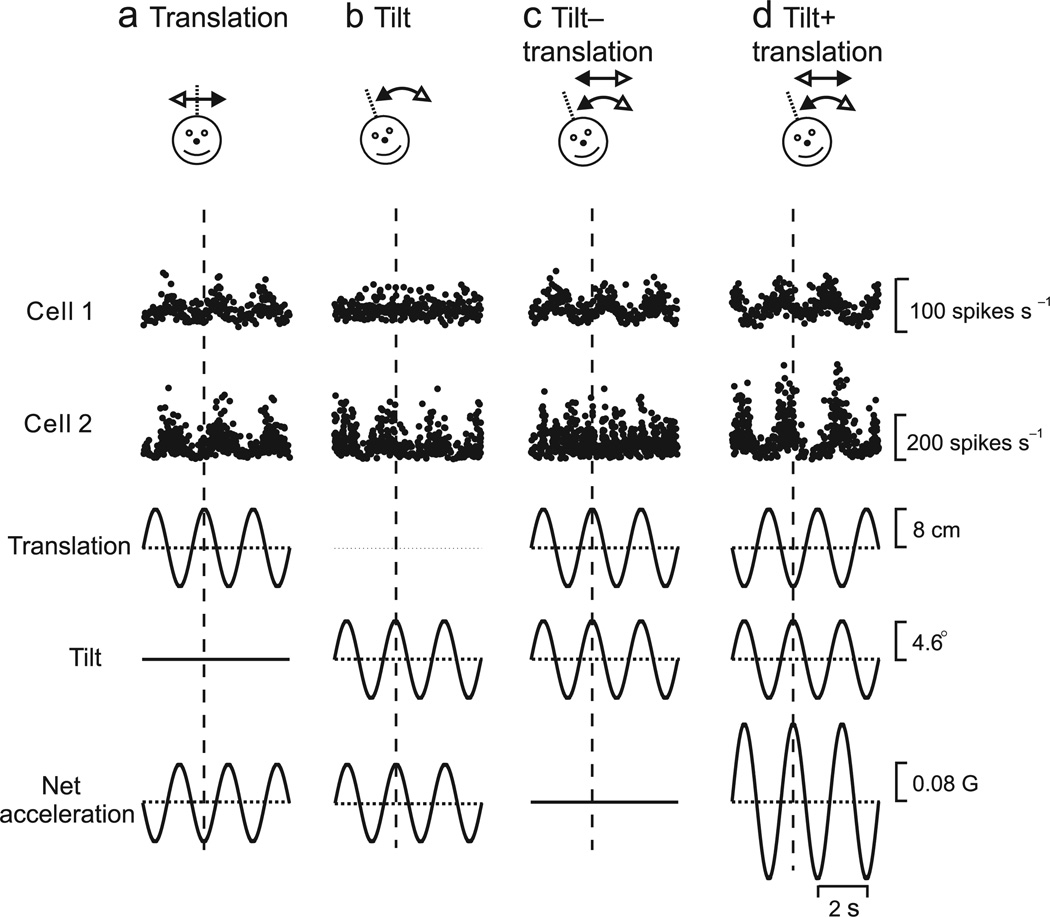
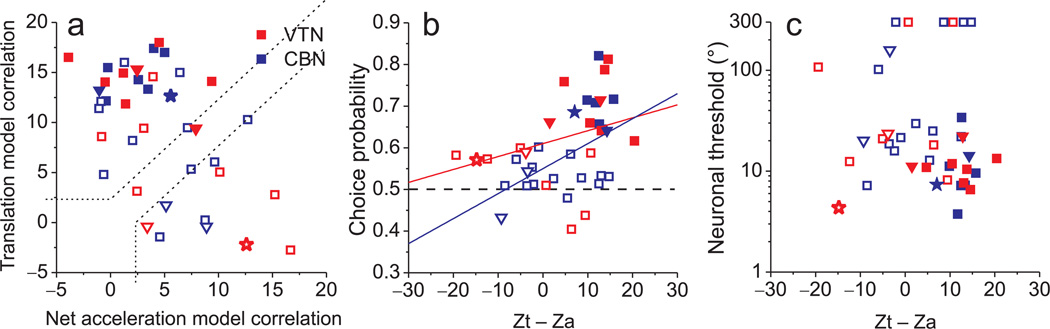
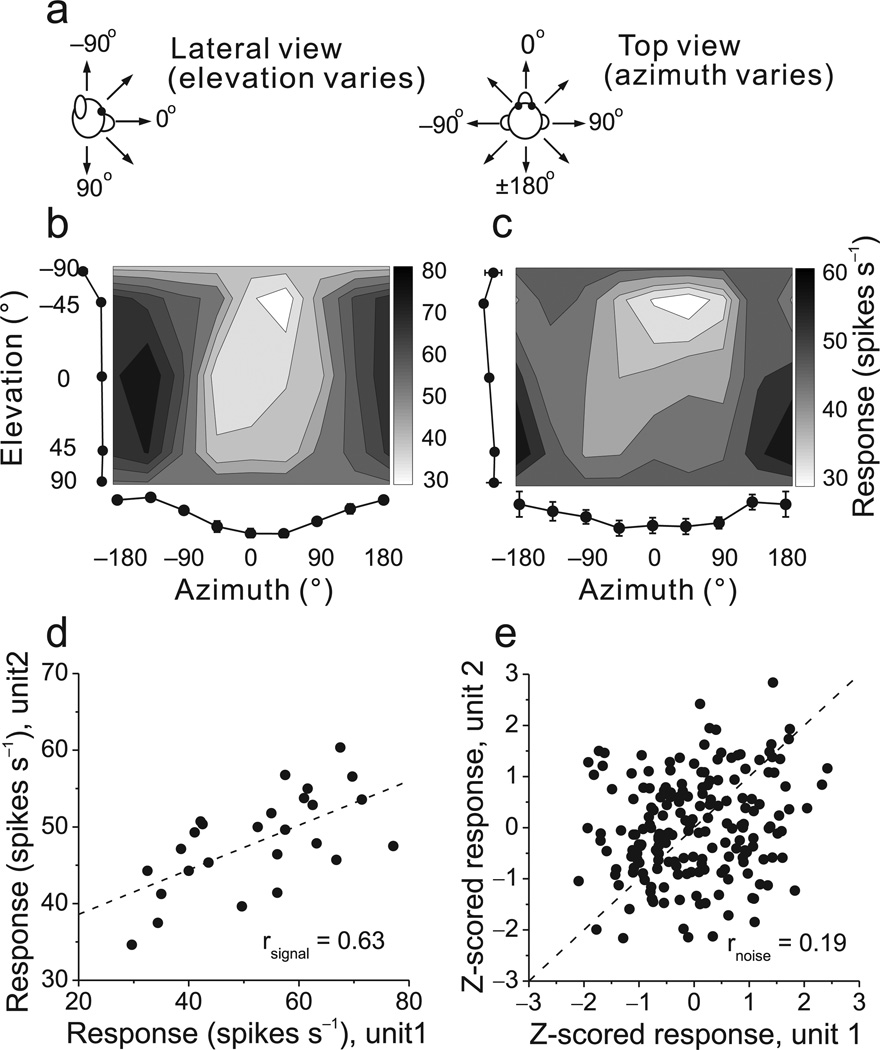
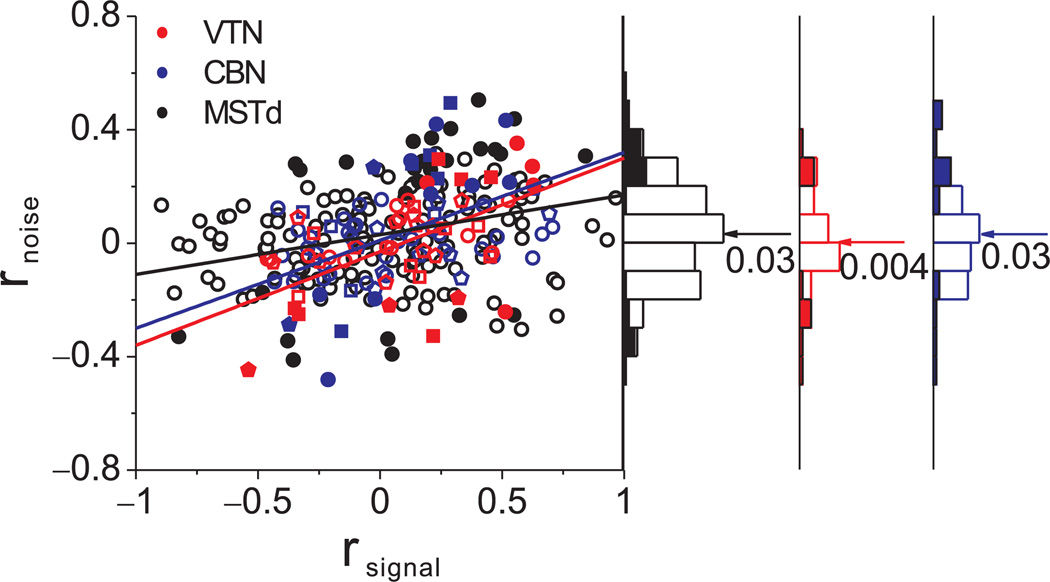
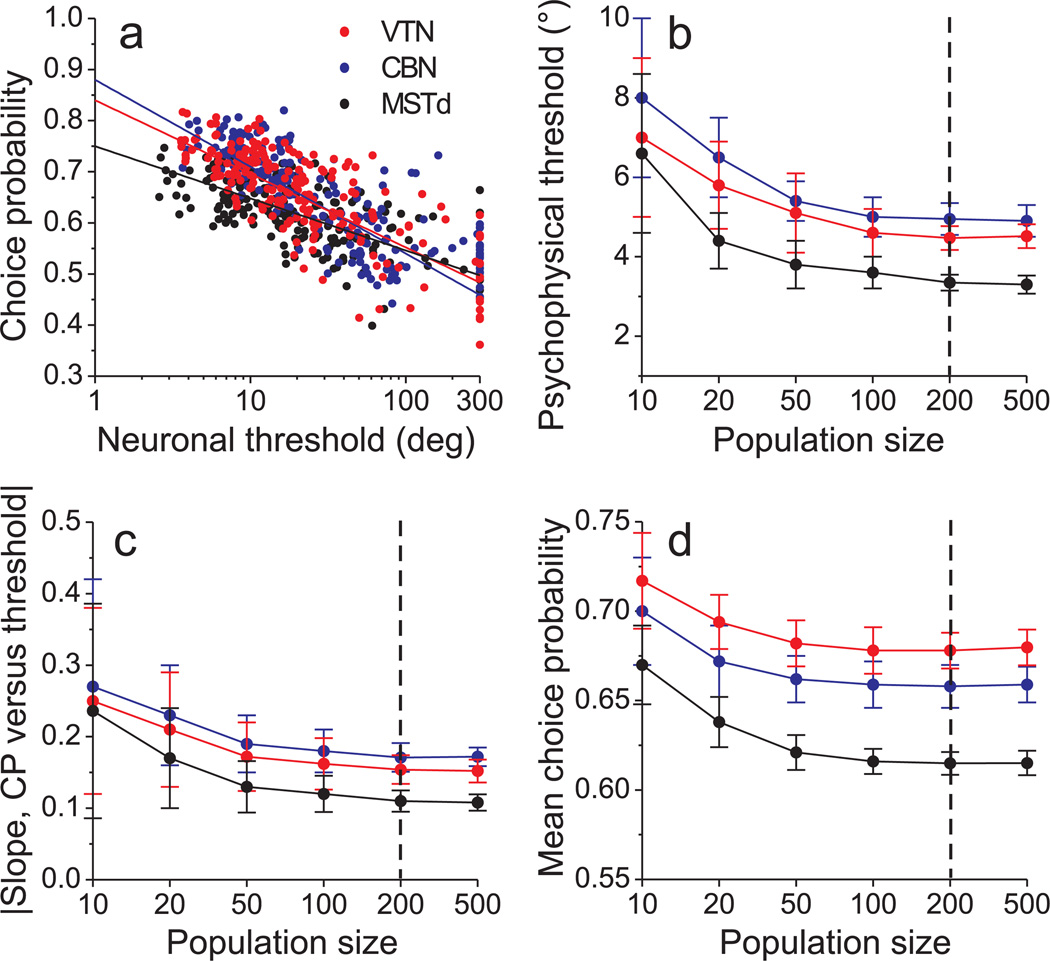
Functional links between neuronal activity and perception are studied by examining trial-by-trial correlations (choice probabilities) between neural responses and perceptual decisions. We addressed fundamental issues regarding the nature and origin of choice probabilities by recording from subcortical (brainstem and cerebellar) neurons in rhesus monkeys during a vestibular heading discrimination task. Subcortical neurons showed robust choice probabilities that exceeded those seen in cortex (area MSTd) under identical conditions. The greater choice probabilities of subcortical neurons could be predicted by a stronger dependence of correlated noise on tuning similarity, as revealed by population decoding. Significant choice probabilities were observed almost exclusively for neurons that responded selectively to translation, whereas neurons that represented net gravito-inertial acceleration did not show choice probabilities. These findings suggest that the emergence of choice probabilities in the vestibular system depends on a critical signal transformation that occurs in subcortical pathways to distinguish translation from orientation relative to gravity.


Figures

Figure 1
Figure 1
Quantification of neuronal sensitivity for an exemplar CBN neuron recorded during the heading discrimination task. (a) Response PSTHs for the 7 distinct heading directions. (b) Tuning curve, plotting firing rate (mean±s.e.m.) as a function of heading direction over a narrow range around straight-forward. Positive and negative headings indicate rightward and leftward directions, respectively. (c) Firing rate distributions for pairs of comparison headings, ± 6.4°, ±2.6° and ±1°. (d) Example neurometric function (filled symbols) showing proportion of ‘rightward’ decisions of an ideal observer as a function of heading direction. Each data point represents an ROC value computed from distributions like those shown in (c). The corresponding psychometric function is superimposed (open symbols). Solid and dashed lines show cumulative Gaussian fits. (e) Distribution of firing rates of the same neuron in response to an ambiguous 0° (straight forward) heading stimulus, grouped according to whether the monkey reported 'leftward' or 'rightward' motion. These distributions yielded a highly significant choice probability of 0.76 (p<<0.001).
Figure 2
Figure 2
Summary of neural sensitivity, choice probability, and tuning curves. (a) Scatter plot of choice probabilities against neuronal thresholds. Data are shown separately for VTN (red), CBN (blue), and MSTd (black). Solid lines indicate linear fits (type II regression, fit to threshold values ≤200). Filled symbols represent choice probability values that are significantly different from 0.5 (p < 0.05, permutation test). Symbol shapes denote data from different animals: upward triangles: monkey M (n=7); circles: monkey W (n=31); squares: monkey Y (n=49); downward triangles: monkey O (n=10). Also shown are marginal distributions of neuronal thresholds and choice probabilities. Filled and open bars indicate neurons with significant and non-significant choice probabilities, respectively. Arrows indicate the mean values. (b), (c) Relationship between neuronal threshold and local tuning curve slope (b) or response variance (c). Tuning curve slope was calculated by linear regression, over the narrow range of headings tested in the discrimination task. Response variance was computed only from the 0° heading data. (d), (e) Population heading tuning curves from CBN (blue, n=107), VTN (red, n=70) and MSTd (black, n=342) neurons before (d) and after (e) subtraction of spontaneous activity. Responses from each neuron were shifted along the horizontal axis to align the peaks of all tuning curves (at 0°) before averaging. Error bars denote s.e.m.
Figure 3
Figure 3
Time courses of response amplitude, neuronal thresholds, and choice probabilities. (a) Average evoked responses at the preferred heading (with spontaneous activity subtracted) for 56 CBN neurons (blue), 41 VTN neurons (red) and 183 MSTd neurons (black). The stimulus motion profile is also shown (solid gray curve: velocity; dashed gray curve: acceleration). (b), (c) Average neuronal threshold and choice probability as a function of time. Each point represents data computed in a 400ms analysis window that is shifted by a multiple of 100ms. Error bars denote s.e.m.
Figure 4
Figure 4
Examples of CBN (cell 1) and VTN (cell 2) responses during sinusoidal stimulation protocols involving (a) translation only, (b) tilt only, and (c), (d) combined translation and tilt. For ‘tilt−translation’ (c), translational and gravitational accelerations cancel each other; for ‘tilt+translation’ (d), the translational and gravitational accelerations add together. Translation and tilt waveforms (bottom traces) were tailored in both amplitude and direction to elicit identical net accelerations in the horizontal plane, . Vertical dotted lines mark stimulus peak.
Figure 5
Figure 5
Choice probabilities depend on the translation/net acceleration coding property of VTN/CBN cells. (a) Scatter plot of z-transformed partial correlation coefficients derived from fits of each cell’s responses with a translation-coding model and net-acceleration-coding model. Dashed lines divide the plots into three regions: an upper/left area corresponding to responses that are significantly better fit by the translation-coding model, a lower/right area that includes neurons that are significantly better fit by the net acceleration-coding model, and an intermediate zone in which neither model is significantly better than the other. Star-shaped symbols mark the 2 cells from Fig. 4. (b) Scatter plot of choice probability vs. the difference in z-scores between the translation and net-acceleration models (Zt – Za). Red and blue lines represent type II linear regression fits for VTN and CBN, respectively. (c) Scatter plot of neuronal threshold vs. the difference in z-score between translation and net acceleration models. In all panels, filled symbols denote cells with significant choice probabilities, whereas open symbols denote non-significant choice probabilities (CBN: blue; VTN: red; MSTd: black). Downward pointing triangles and squares indicate data from monkeys O (n=6) and Y (n=34), respectively.
Figure 6
Figure 6
Measuring noise correlation (rnoise) and signal correlation (rsignal) between pairs of single neurons. (a) Schematic illustration of the azimuth and elevation variables in the heading tuning protocol. (b), (c) Example heading tuning profiles for a pair of simultaneously recorded CBN neurons. Grayscale maps (Lambert cylindrical equal-area projections) show mean firing rate as a function of azimuth and elevation angles. The tuning curves along the margins of each grayscale map illustrate mean ±SEM firing rates plotted as a function of either elevation or azimuth (averaged across azimuth or elevation, respectively). (d) Comparison of the mean responses of the two neurons across all heading directions. The Pearson correlation coefficient of the mean responses quantifies ‘signal correlation’, rsignal =0.63. (e) Normalized responses from the same two neurons were weakly correlated across trials. Each datum represents z-scored responses from one trial. The Pearson correlation coefficient of the data quantifies ‘noise correlation’, rnoise =0.19. Dashed lines: unity-slope diagonals.
Figure 7
Figure 7
Relationship between noise correlation (rnoise) and signal correlation (rsignal). Scatter plot of rnoise versus rsignal for pairs of neurons from VTN (red), CBN (blue) and MSTd (black). Marginal distributions of rnoise are also shown (right panels). Arrows and numbers mark the mean values of rnoise for each area. Symbol shape denotes different animals (circles: monkey W, n=59; squares: monkey Y, n=23; pentagon: monkey V, n=28), and lines represent type II linear regression fits.
Figure 8
Figure 8
Predicted relationship between choice probabilities and neuronal thresholds, derived from decoding simulated population responses. (a) Predicted choice probabilities against neuronal thresholds for a simulated population of 200 neurons from each area. Data are shown for one instantiation of the simulation. Solid lines indicate linear fits (type II regression, fit to threshold data ≤200). (b) The predicted psychophysical threshold (from decoding) is plotted as a function of the number of neurons in the simulated neural populations. Data points represent averages across 30 iterations of the simulation, with each iteration based on a different re-sampling (with replacement) of neurons from the original data sets. Error bars denote s.d. Data are shown for CBN (blue), VTN (red) and MSTd (black). (c) Average slope of the type II linear regression fit to the choice probability vs. neuronal threshold relationship as a function of population size. Each data point represents mean (±95% confidence interval) values obtained from 30 iterations of the simulation. (d) Average choice probability (±s.d.) as a function of population size for each area.

References

    1. Britten KH, Newsome WT, Shadlen MN, Celebrini S, Movshon JA. A relationship between behavioral choice and the visual responses of neurons in macaque MT. Vis Neurosci. 1996;13:87–100. - PubMed
    1. Dodd JV, Krug K, Cumming BG, Parker AJ. Perceptually bistable three-dimensional figures evoke high choice probabilities in cortical area MT. J Neurosci. 2001;21:4809–4821. - PMC - PubMed
    1. Liu J, Newsome WT. Correlation between speed perception and neural activity in the middle temporal visual area. J Neurosci. 2005;25:711–722. - PMC - PubMed
    1. Purushothaman G, Bradley DC. Neural population code for fine perceptual decisions in area MT. Nat Neurosci. 2005;8:99–106. - PubMed
    1. Uka T, DeAngelis GC. Contribution of area MT to stereoscopic depth perception: choice-related response modulations reflect task strategy. Neuron. 2004;42:297–310. - PubMed

Publication types