. 2013 Feb;24(1-2):54-62.
doi: 10.1007/s00335-012-9437-8. Epub 2012 Nov 21.

Presphenoidal synchondrosis fusion in DBA/2J mice

Affiliations

Presphenoidal synchondrosis fusion in DBA/2J mice

Allysa Adams et al. Mamm Genome. 2013 Feb.

Abstract

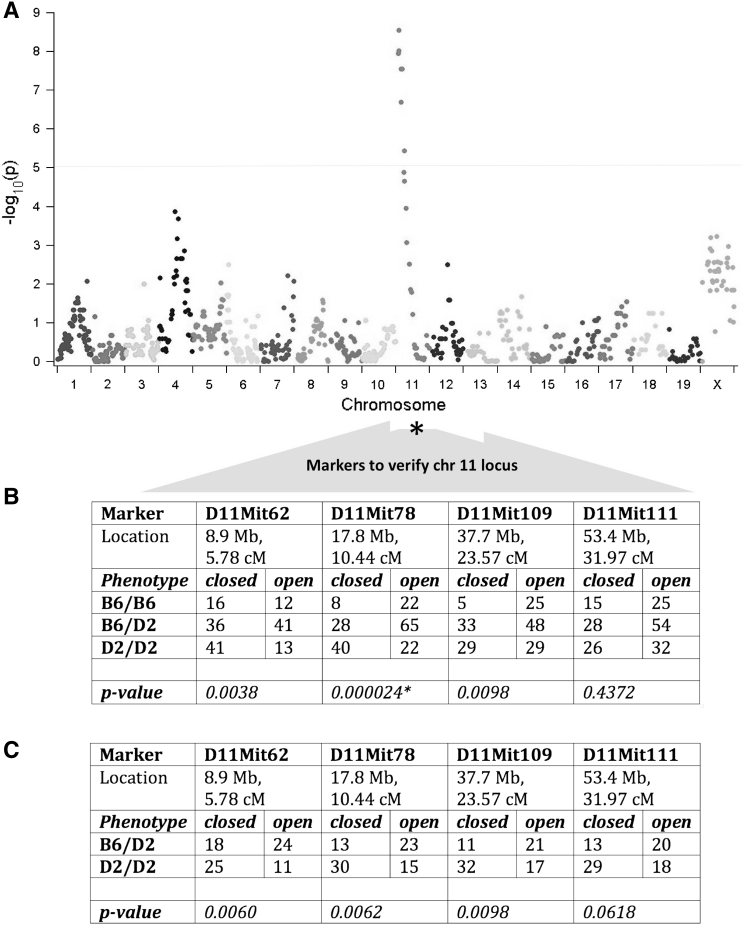
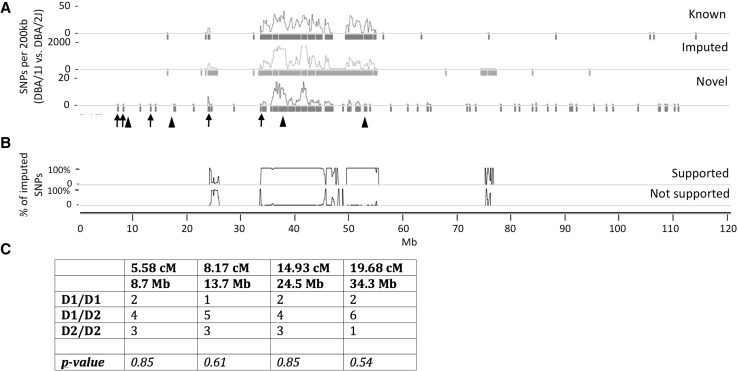
Cranial base growth plates are important centers of longitudinal growth in the skull and are responsible for the proper anterior placement of the face and the stimulation of normal cranial vault development. We report that the presphenoidal synchondrosis (PSS), a midline growth plate of the cranial base, closes in the DBA/2J mouse strain but not in other common inbred strains. We investigated the genetics of PSS closure in DBA/2J mice by evaluating F1, F1 backcross, and/or F1 intercross offspring from matings with C57BL/6J and DBA/1J mice, whose PSS remain open. We observed that PSS closure is genetically determined, but not inherited as a simple Mendelian trait. Employing a genome-wide SNP array, we identified a region on chromosome 11 in the C57BL/6J strain that affected the frequency of PSS closure in F1 backcross and F1 intercross offspring. The equivalent region in the DBA/1J strain did not affect PSS closure in F1 intercross offspring. We conclude that PSS closure in the DBA/2J strain is complex and modified by different loci when outcrossed with C57BL/6J and DBA/1J mice.


Figures

Fig. 1
Fig. 1
Closure of the presphenoidal synchondrosis occurs in the DBA/2J inbred strain. a Photograph of a newborn (P1) C57BL/6J cranial base (shown from a superior view after the brain was removed) that had been stained with Alcian blue and Alizarin red to indicate cartilage and bone, respectively. Important landmark structures are noted; the presphenoid synchondrosis (PSS) is located between the presphenoid (PS) and basisphenoid (BS) bones. b Photographs of adult cranial bases, stained with Alcian blue and Alizarin red, demonstrating a symmetric and patent structure in C57BL/6J and a closed PSS in DBA/2J (arrow). c Cranial bases of DBA/2J mice at different postnatal ages stained with Alcian blue and Alizarin red. The dashed box indicates the location of the PSS. The P15 specimen demonstrates bilateral bony fusion across the PSS. The P25 specimen demonstrates unilateral bony fusion with resultant angular deformity. Bilateral fusion with residual cartilage is seen in the P40 specimen, whereas the cartilage is absent in the P50 specimen (Color figure online)
Fig. 2
Fig. 2
Histologic analysis of PSS closure in DBA/2J mice. a Photograph of a midline sagittal section through a P1 C57BL/6J mouse cranium; a photomicrograph within the oval contains an enlargement of the area with the PSS superimposed. Photomicrograph on the right is from a C57BL/6J P1 mouse with the PSS in a rostral (R)–caudal (C) orientation. The bilaterally symmetric resting zone (RZ), proliferating zone (PZ), and hypertrophic zone (HZ) chondrocyte-containing regions are indicated. Scale bar 200 μm. b Photomicrographs of midline sagittal sections through the PSS of C57BL/6J (B6) and DBA/2J (D2) mice at 1, 3, 5, and 10 days after birth (P1, P3, P5, P10) stained with hematoxylin and eosin. C57BL/6J and DBA/2J mice have similar looking PSS at P1 and P3, although the rostral–caudal length consistently appears shorter in DBA/2J than in C57BL/6J mice. By P5, the PSS in the DBA/2J mouse has lost rostral–caudal symmetry; instead, the HZ is at the ventral surface (arrow) and the RZ bulges from the dorsal surface. At P10, the PSS in the DBA/2J mouse lacks recognizable RZ, PZ, and HZ regions, whereas the RZ region is readily seen in the C57BL/6J PSS. Scale bars 100 μm (Color figure online)
Fig. 3
Fig. 3
PSS closure is influenced by a locus on chromosome 11 but is not a simple Mendelian trait. a Manhattan plot depicting −log10 p values for 856 informative SNPs that were genotyped in 37 offspring from DBA/2J × C57BL/6J F1 intercross. All 37 offspring had exhibited PSS closure by P21. A dotted horizontal line (at −log10 p = 5) indicates the threshold for genome-wide significance. p values for several SNPs on proximal chromosome 11 exceed this threshold. b Table containing the frequencies of homozygous C57BL/6J genotypes (B6/B6), compound heterozygous C57BL/6J/DBA/2J genotypes (B6/D2), and homozygous DBA/2J genotypes (D2/D2) for microsatellite markers in a larger series of DBA/2J × C57BL/6J F1 intercross offspring that exhibited closure of the PSS (closed) or patency of the PSS (open) at P21. All offspring with PSS closure were genotyped, as were an equal number of randomly chosen offspring that had patent PSS. There was no enrichment for D2/D2 genotypes among offspring with open PSS, whereas D2/D2 genotypes were significantly enriched in offspring with PSS closure (p values represent the difference in the genotype distribution between offspring with closed and open PSS as determined by χ2 analysis). Significant p values were also obtained when the genotype distributions in offspring with closed PSS were compared with the null hypothesis (not shown). c Table containing the frequencies of compound heterozygous C57BL/6J/DBA/2J genotypes (B6/D2) and homozygous DBA/2J genotypes (D2/D2) for microsatellite markers F1 × DBA/2J backcross offspring that exhibited closure of the PSS (closed) or patency of the PSS (open) at P21. D2/D2 genotypes were significantly enriched in offspring with PSS closure (p values represent the difference in the genotype distribution between offspring with closed and open PSS as determined by χ2 analysis). Significant p values were also obtained when the genotype distributions in offspring with closed PSS were compared with the null hypothesis (not shown) (Color figure online)
Fig. 4
Fig. 4
Chromosome 11 SNPs that distinguish the DBA/1J and DBA/2J strains. a Graph depicting the density (per 200-kb window) and distribution of SNPs that differ between the DBA/1J and DBA/2J strains across chromosome 11. Density tracings (SNPs/200 kb) represent previously known (blue), imputed (gray), and newly identified (red) SNPs. Colored bars below each density tracing are used to indicate when a 200-kb window contains at least one SNP. Locations of the SNPs and microsatellites that were used to genotype individual mice are indicated by arrows and arrowheads, respectively. b Graph depicting the percentage of imputed SNPs whose existence is supported (upper) or not supported (lower) by our data. When calculating these percentages, only SNPs covered by at least one read in both DBA/1J and DBA/2J were considered. c Table containing the frequencies of homozygous DBA/1J genotypes (D1/D1), compound heterozygous DBA/1J/DBA/2J genotypes (D1/D2), and homozygous DBA/2J genotypes (D2/D2) for SNPs in the nine P35 DBA/1J × DBA/2J F1 intercross offspring that still had an open PSS (Color figure online)

Similar articles

Cited by

References

    1. Bjork A. Cranial base development. Am J Orthod. 1955;41:199–255. doi: 10.1016/0002-9416(55)90005-1. - DOI
    1. Borowski A, Dirksen U, Lixin L, Shi RL, Göbel U, Schneider EM. Structure and function of ETAA16: a novel cell surface antigen in Ewing’s tumours. Cancer Immunol Immunother. 2006;55:363–374. doi: 10.1007/s00262-005-0017-6. - DOI - PMC - PubMed
    1. Bourgeois P, Bolcato-Bellemin AL, Danse JM, Bloch-Zupan A, Yoshiba K, Stoetzel C, Perrin-Schmitt F. The variable expressivity and incomplete penetrance of the twist-null heterozygous mouse phenotype resemble those of human Saethre–Chotzen syndrome. Hum Mol Genet. 1998;7:945–957. doi: 10.1093/hmg/7.6.945. - DOI - PubMed
    1. Bowen ME, Boyden ED, Holm IA, Campos-Xavier B, Bonafe L, Superti-Furga A, Ikegawa S, Cormier-Daire V, Bovee JV, Pansuriya TC, de Sousa SB, Savarirayan R, Andreucci E, Vikkula M, Garavelli L, Pottinger C, Ogino T, Sakai A, Regazzoni BM, Wuyts W, Sangiorgi L, Pedrini E, Zhu M, Kozakewich HP, Kasser JR, Seidman JG, Kurek KC, Warman ML. Loss-of-function mutations in PTPN11 cause metachondromatosis, but not Ollier disease or Maffucci syndrome. PLoS Genet. 2011;7:e1002050. doi: 10.1371/journal.pgen.1002050. - DOI - PMC - PubMed
    1. Bowen ME, Henke K, Siegfried KR, Warman ML, Harris MP. Efficient mapping and cloning of mutations in zebrafish by low coverage whole genome sequencing. Genetics. 2012;190:1017–1024. doi: 10.1534/genetics.111.136069. - DOI - PMC - PubMed

Publication types

MeSH terms

LinkOut - more resources