. 2013 Apr;81(4):583-91.
doi: 10.1002/prot.24213. Epub 2013 Jan 15.

Vivaldi: visualization and validation of biomacromolecular NMR structures from the PDB

Affiliations
Free PMC article

Vivaldi: visualization and validation of biomacromolecular NMR structures from the PDB

Pieter M S Hendrickx et al. Proteins. 2013 Apr.
Free PMC article

Abstract

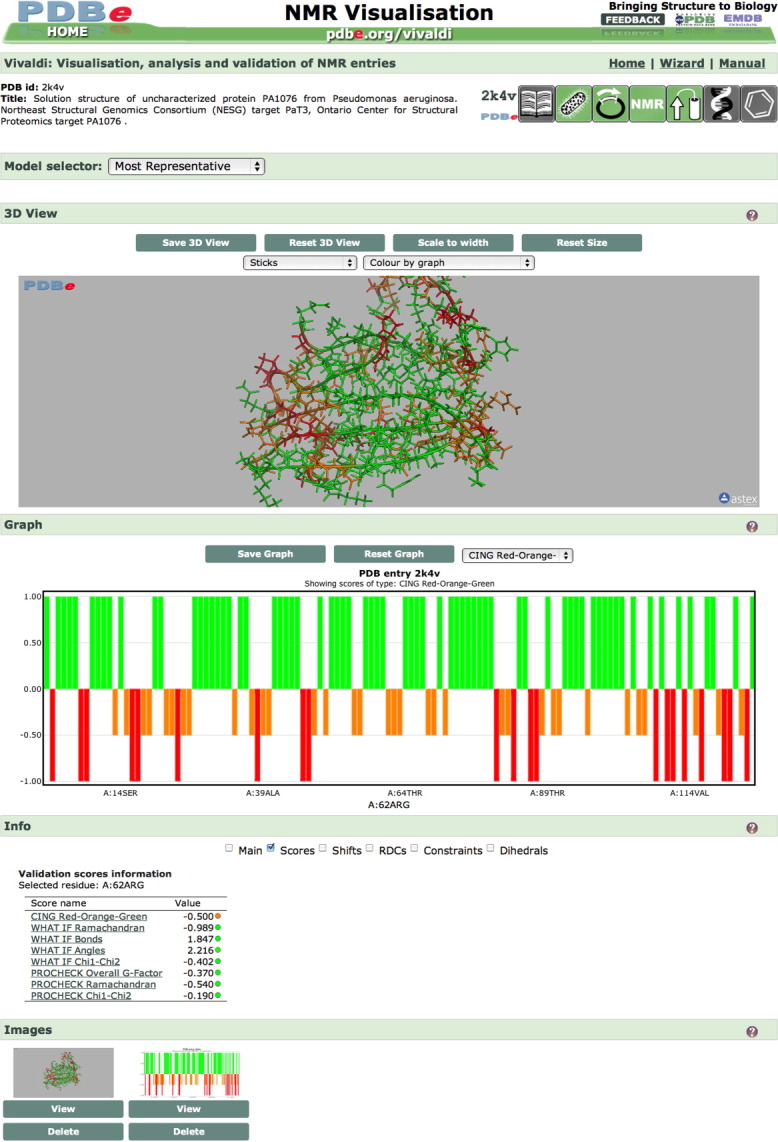
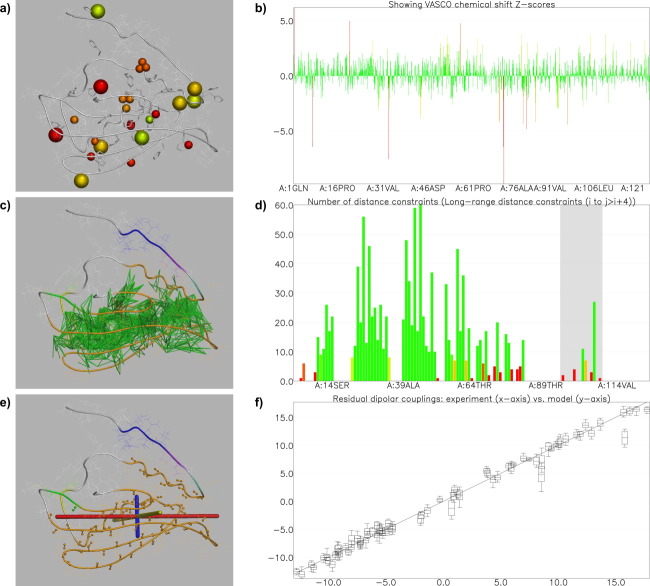
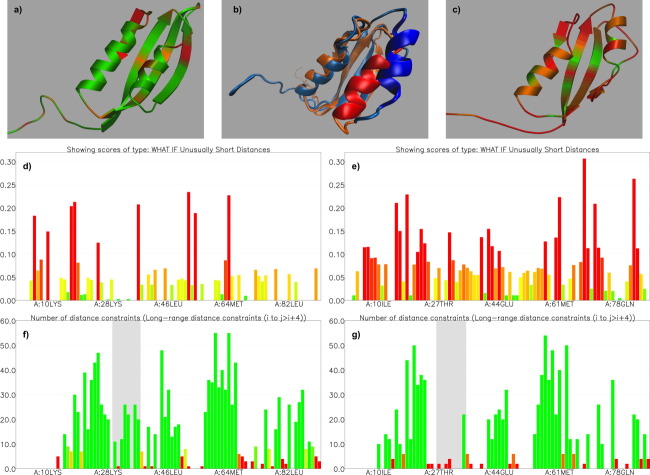
We describe Vivaldi (VIsualization and VALidation DIsplay; http://pdbe.org/vivaldi), a web-based service for the analysis, visualization, and validation of NMR structures in the Protein Data Bank (PDB). Vivaldi provides access to model coordinates and several types of experimental NMR data using interactive visualization tools, augmented with structural annotations and model-validation information. The service presents information about the modeled NMR ensemble, validation of experimental chemical shifts, residual dipolar couplings, distance and dihedral angle constraints, as well as validation scores based on empirical knowledge and databases. Vivaldi was designed for both expert NMR spectroscopists and casual non-expert users who wish to obtain a better grasp of the information content and quality of NMR structures in the public archive.


Figures

Figure 1
Figure 1
Layout of a Vivaldi page showing the default view for protein PA1076 from Pseudomonas aeruginosa (PDB entry 2k4v). The page contains a header including PDBprints, an interactive 3D viewer (OpenAstexViewer), a graph and a textual information section. The most representative model according to OLDERADO cluster analysis is displayed in the 3D viewer and the graph shows the NRG-CING red-orange-green (ROG) scores for this protein.
Figure 2
Figure 2
Vivaldi visualization of experimental data for protein PA1076 from Pseudomonas aeruginosa (PDB entry 2k4v). (a,b) Presentation of VASCO analysis of chemical shifts. (a) Nuclei with unusual chemical shifts are shown as spheres in the 3D viewer; aromatic residues are shown as sticks, to remind the user that the effect of aromatic ring currents is not explicitly accounted for in the VASCO analysis. (b) The same information is displayed in an interactive graph vs. residue number. (c,d) Analysis of distance constraints. (c) The most representative model of the ensemble is shown, colored by rigid-body domains as determined by OLDERADO. All long-range distance constraints (five or more residues apart in sequence) are shown as green sticks in the 3D viewer. (d) Graph of the number of long-range distance constraints per residue. The shaded area of the graph corresponds to helix 91–105 (UniProt numbering). (e) The chemical groups, for example N–HN, for which RDCs are available are shown as balls and sticks. Principal axes of the alignment tensor are also displayed. (f) Correlation plot of calculated vs. experimental RDCs. For each datapoint, the middle bar shows the calculated RDC averaged over the ensemble, and the box represents the standard deviation, while the whiskers are the minimum and maximum values calculated from the ensemble.
Figure 3
Figure 3
Comparison of two NMR solution structures for protein HP_0495 from Helicobacter pylori (PDB codes 2joq, left, and 2h9z, right). (a,c) The 3D viewers show the most representative model of each ensemble, colored by the NRG-CING red-orange-green scores, which are calculated for the entire ensemble. (b) Superposition of the most representative models from the two structures, highlighting the differences in the conformation of helix I and adjacent loops. Image created in VMD (d,e). Graphs of per-residue WHATIF scores reporting unusual short distances in the entire ensemble. (f,g) Graphs of the number of long-range distance constraints for each residue. Long-range constraints are defined as connecting two atoms that are five or more residues apart in the amino-acid sequence.

References

    1. Berman HM. The Protein Data Bank: a historical perspective. Acta Crystallogr A. 2008;64:88–95. - PubMed
    1. Bernstein FC, Koetzle TF, Williams GJB, Meyer EF, Brice MD, Rodgers JR, Kennard O, Shimanouchi T, Tasumi M. Protein Data Bank—computer-based archival file for macromolecular structures. J Mol Biol. 1977;112:535–542. - PubMed
    1. UniProt Consortium. Reorganizing the protein space at the Universal Protein Resource (UniProt) Nucleic Acids Res. 2012;40:D71–D75. - PMC - PubMed
    1. Berman H, Henrick K, Nakamura H, Markley JL. The worldwide Protein Data Bank (wwPDB): ensuring a single, uniform archive of PDB data. Nucleic Acids Res. 2007;35:D301–D303. - PMC - PubMed
    1. Berman HM, Westbrook J, Feng Z, Gilliland G, Bhat TN, Weissig H, Shindyalov IN, Bourne PE. The Protein Data Bank. Nucleic Acids Res. 2000;28:235–242. - PMC - PubMed

Publication types

Substances