

. 2012 Dec 21;8(24):3714-9; author reply 3720-6.
doi: 10.1002/smll.201001465.
Epub 2012 Nov 23.
Stripy nanoparticles revisited
- PMID: 23180635
- PMCID: PMC3561705
- DOI: 10.1002/smll.201001465
Item in Clipboard
Stripy nanoparticles revisited
Small.
.
Free PMC article
No abstract available
Figures

Comparison of the predicted and reported stripe widths for a 5.8 nm diameter nanoparticle. a) STM tip scanning over a stripy nanoparticle perpendicularly to the stripe orientation (section view); b) predicted STM image with color coding showing the predicted height at each position; c) height profile corresponding to the white line in (b); d) experimental STM image (adapted from Figure 1b of Jackson et al.1); e) Height profile corresponding to the white line in image (d), (adapted from Figure 1d of Jackson et al.1). Panels (d) and (e) were adapted with permission. Copyright 2004, Macmillan Publishers Ltd.
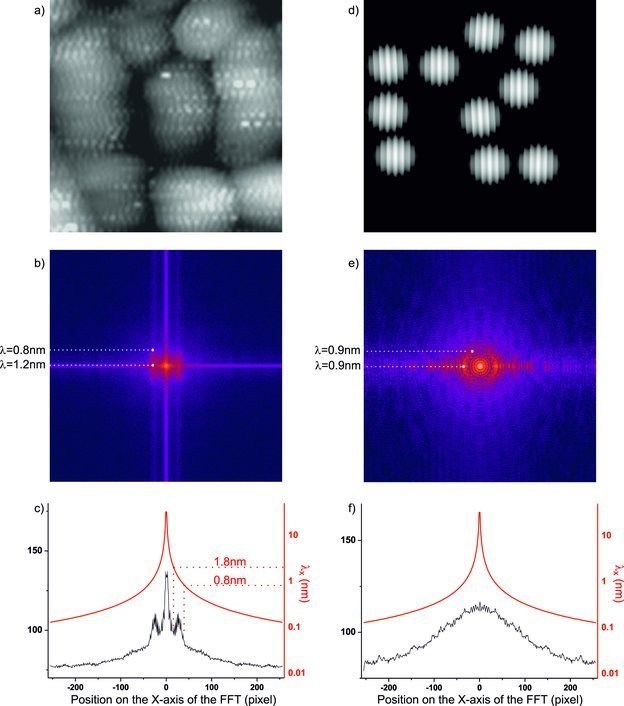
Fast-Fourier transform analysis of experimental and theoretical STM images. a) Experimental STM image (adapted from Figure 1a of Jackson et al. with permission. Copyrigh 2004, Macmillan Publishers Ltd.); b) FFT of the image shown in (a); c) average intensity profile of the entire FFT image along the x-axis; d) exemplary theoretical image of 10 nanoparticles; e) FFT of the image shown in (d); f) average intensity profile of the entire FFT image along the x-axis.

Water-soluble “stripy” (2:1 molar ratio of MUS:OT) nanoparticles. From left to right: a) STM image of a water-soluble particle (adapted from Uzun et al. with permission. Copyright 2008, The Royal Society of Chemistry); b) FFT of the image; c) frequency filter; d) Reverse FFT of (c), i.e., frequency-filtered image. Red arrows point to phase shifts between consecutive scanning lines. e) Intensity profile corresponding to the line in (a).

Internalization of a) 100% MUS-, b) 66% MUS–33%OT-, and, c) 33% MUS–66% OT-capped nanoparticles in HeLa cells. From left to right: overlay of bright field and photothermal image, photothermal image, and 1D profile section of the image (indicated by the white line on the photothermal image). The scale bars represent 10 μm.
References
-
- Jackson AM, Myerson JW, Stellacci F. Nat. Mater. 2004;3:330–336. - PubMed
-
- Jackson AM, Hu Y, Silva PJ, Stellacci F. J. Am. Chem. Soc. 2006;128:11135–11149. - PubMed
-
- Centrone A, Hu Y, Jackson AM, Zerbi G, Stellacci F. Small. 2007;3:814–817. - PubMed
-
- DeVries GA, Brunnbauer M, Hu Y, Jackson AM, Long B, Neltner BT, Uzun O, Wunsch BH, Stellacci F. Science. 2007;315:358–361. - PubMed
-
- Singh C, Ghorai PK, Horsch MA, Jackson AM, Larson RG, Stellacci F, Glotzer SC. Phys. Rev. Lett. 2007;99:226106. - PubMed
Publication types
MeSH terms
Substances
Grants and funding
LinkOut - more resources
Full Text Sources
