. 2013 Jan;41(Database issue):D955-61.
doi: 10.1093/nar/gks1111. Epub 2012 Nov 23.

Genomics of Drug Sensitivity in Cancer (GDSC): a resource for therapeutic biomarker discovery in cancer cells

Affiliations

Genomics of Drug Sensitivity in Cancer (GDSC): a resource for therapeutic biomarker discovery in cancer cells

Wanjuan Yang et al. Nucleic Acids Res. 2013 Jan.

Abstract

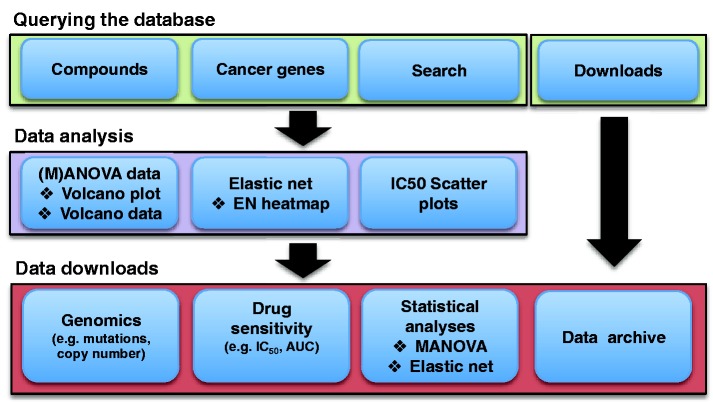
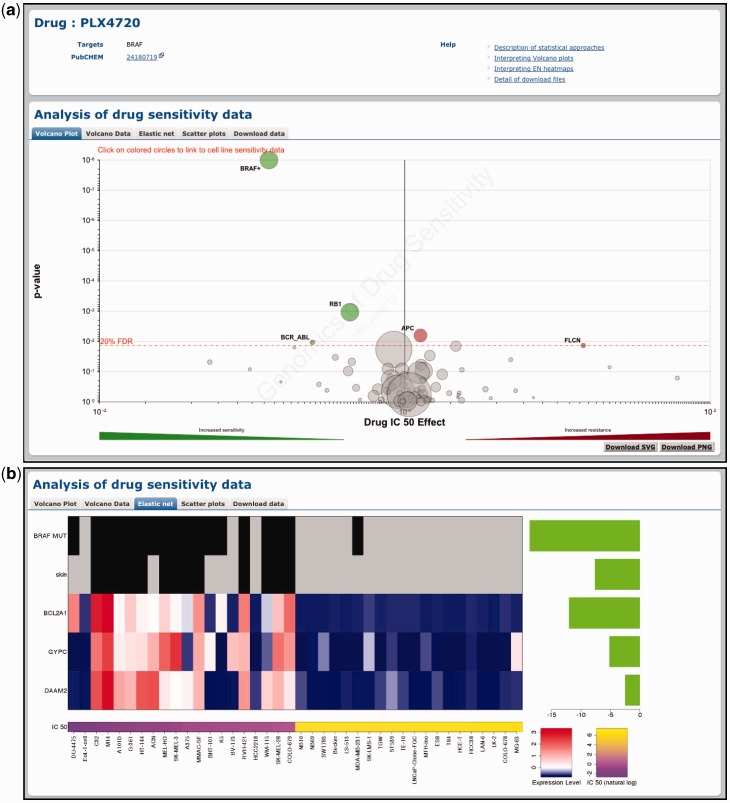
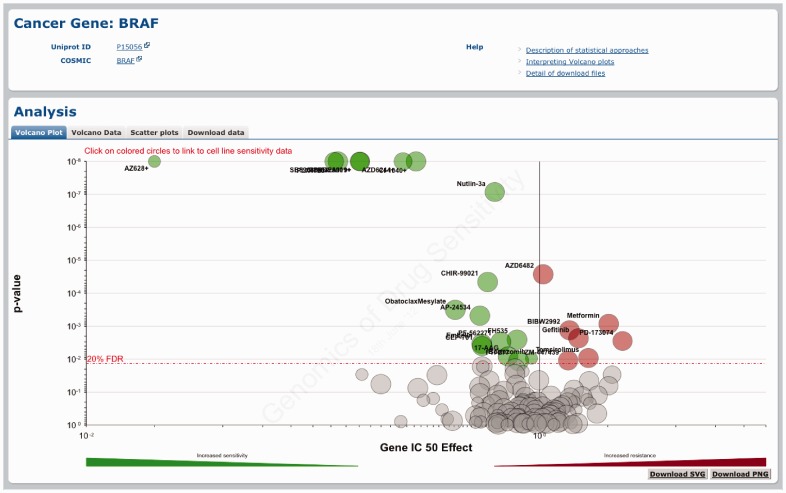
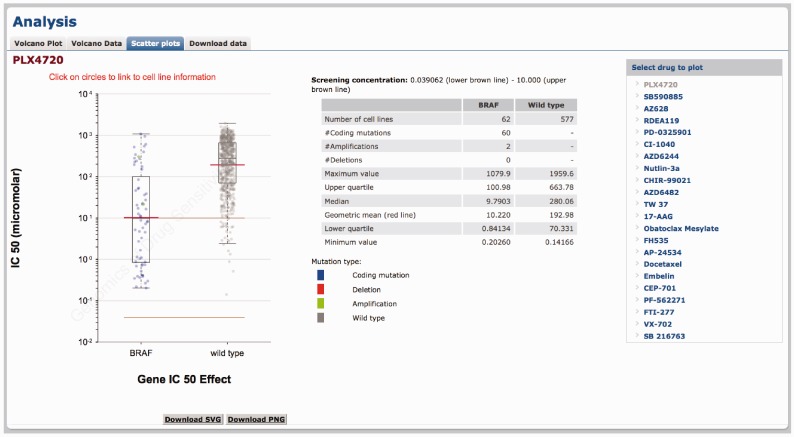
Alterations in cancer genomes strongly influence clinical responses to treatment and in many instances are potent biomarkers for response to drugs. The Genomics of Drug Sensitivity in Cancer (GDSC) database (www.cancerRxgene.org) is the largest public resource for information on drug sensitivity in cancer cells and molecular markers of drug response. Data are freely available without restriction. GDSC currently contains drug sensitivity data for almost 75 000 experiments, describing response to 138 anticancer drugs across almost 700 cancer cell lines. To identify molecular markers of drug response, cell line drug sensitivity data are integrated with large genomic datasets obtained from the Catalogue of Somatic Mutations in Cancer database, including information on somatic mutations in cancer genes, gene amplification and deletion, tissue type and transcriptional data. Analysis of GDSC data is through a web portal focused on identifying molecular biomarkers of drug sensitivity based on queries of specific anticancer drugs or cancer genes. Graphical representations of the data are used throughout with links to related resources and all datasets are fully downloadable. GDSC provides a unique resource incorporating large drug sensitivity and genomic datasets to facilitate the discovery of new therapeutic biomarkers for cancer therapies.


Figures

Figure 1.
Figure 1.
A schematic representation of the GDSC database structure and content. Data are accessed in a hierarchical fashion by either querying by screening compound or cancer gene of interest. This gives access to graphical representations of cell line drug sensitivity data and genomic correlations of drug response in multiple formats through either drug- or gene-specific pages. All data are freely available for download either through gene- or drug-specific pages, or as a whole through the download page.
Figure 2.
Figure 2.
Querying the GDSC database by compound name. Drug-specific pages demonstrate the effect of genomic features on cell line sensitivity to a particular drug. In this example, we show the effect of genomic features on sensitivity to the BRAF-inhibitor PLX4720. (a) A volcano plot representation of MANOVA results showing the magnitude (x-axis) and significance (P-value, log scale on inverted axis) for each cancer gene association. Each circle represents a single drug–gene interaction and the size is proportional to the number of mutant cell lines screened for each drug. For clarity, the y-axis is capped at P = 1 × 10⁻⁸ and a plus sign (+) next to a circle indicates that the P-value is smaller than this threshold. The dashed red line represents a Benjamini–Hochberg multiple testing correction for significance and only significant associations are coloured either green for drug sensitivity or red for resistance. (b) Elastic net analysis of genomic features associated with sensitivity to PLX4720. Features with negative effect size are associated with drug sensitivity and features with positive effect size are associated with drug resistance (all features are negative in this example). Mutation and tissue features are at the top of the heatmap to represent the presence (black) or absence (grey) of a mutation/tissue subtype. Below this are gene expression and copy number features with blue corresponding to lower expression or copy number, and red to indicate higher expression or copy number.
Figure 3.
Figure 3.
Querying the GDSC database by cancer gene. Gene-specific pages show how a cancer gene mutation affects response to many drugs. A volcano plot representation shows results of the MANOVA analysis for drug sensitivity associated with BRAF mutations.
Figure 4.
Figure 4.
Scatter plot of cell line IC50 values and the effect of a cancer mutation. A scatter plot of cell line IC50 values for BRAF-mutated versus wild-type cell lines following drugging with PLX4720. Each circle represents the IC50 value for an individual cell line plotted on a logarithmic scale and the red line is the geometric mean of the population. Cell lines are colour coded to indicate whether the mutation is a coding mutation detected by sequencing, or an amplification or deletion detected by copy number analysis. The lower and upper brown lines indicate the minimum and maximum concentration in micro-molar of drug used for screening. Super-imposed on the scatter plot is a box-and-whisker plot showing the median, interquartile ranges and max and min for each plot. The central panel contains statistics for the plot and the right-hand table allows users to select which drug data to plot.

References

    1. Druker BJ, Guilhot F, O’Brien SG, Gathmann I, Kantarjian H, Gattermann N, Deininger MW, Silver RT, Goldman JM, Stone RM, et al. Five-year follow-up of patients receiving imatinib for chronic myeloid leukemia. N. Engl. J. Med. 2006;355:2408–2417. - PubMed
    1. Chapman PB, Hauschild A, Robert C, Haanen JB, Ascierto P, Larkin J, Dummer R, Garbe C, Testori A, Maio M, et al. Improved survival with vemurafenib in melanoma with BRAF V600E mutation. N. Engl. J. Med. 2011;364:2507–2516. - PMC - PubMed
    1. Kwak EL, Bang YJ, Camidge DR, Shaw AT, Solomon B, Maki RG, Ou SH, Dezube BJ, Janne PA, Costa DB, et al. Anaplastic lymphoma kinase inhibition in non-small-cell lung cancer. N. Engl. J. Med. 2010;363:1693–1703. - PMC - PubMed
    1. Stratton MR. Exploring the genomes of cancer cells: progress and promise. Science. 2011;331:1553–1558. - PubMed
    1. Barretina J, Caponigro G, Stransky N, Venkatesan K, Margolin AA, Kim S, Wilson CJ, Lehar J, Kryukov GV, Sonkin D, et al. The Cancer Cell Line Encyclopedia enables predictive modelling of anticancer drug sensitivity. Nature. 2012;483:603–607. - PMC - PubMed

Publication types