. 2012 Dec 7;338(6112):1308-13.
doi: 10.1126/science.1228757. Epub 2012 Nov 22.

Crystal structure of the calcium release-activated calcium channel Orai

Affiliations

Crystal structure of the calcium release-activated calcium channel Orai

Xiaowei Hou et al. Science. .

Abstract

The plasma membrane protein Orai forms the pore of the calcium release-activated calcium (CRAC) channel and generates sustained cytosolic calcium signals when triggered by depletion of calcium from the endoplasmic reticulum. The crystal structure of Orai from Drosophila melanogaster, determined at 3.35 angstrom resolution, reveals that the calcium channel is composed of a hexameric assembly of Orai subunits arranged around a central ion pore. The pore traverses the membrane and extends into the cytosol. A ring of glutamate residues on its extracellular side forms the selectivity filter. A basic region near the intracellular side can bind anions that may stabilize the closed state. The architecture of the channel differs markedly from other ion channels and gives insight into the principles of selective calcium permeation and gating.


Figures

Fig. 1
Fig. 1
Channel reconstitution in liposomes. (A) Schematic of the fluorescence-based flux assay. Vesicles containing Orai or those prepared without protein (empty vesicles) were loaded with 150 mM NaCl and diluted 100-fold into flux buffer containing a fluorescent pH indicator (ACMA) and 150 mM n-methyl-d-glucamine (NMDG) to establish a Na+ gradient. After stabilization of the fluorescence signal (150 sec) a proton ionophore (CCCP) was added to the sample, and an electrical potential arising from Na+ efflux was used to drive the uptake of protons into the vesicles, which quenches the fluorescence of ACMA. The “X” indicates that ACMA is no longer membrane permeable in the protonated form. (B) Fluorescence measurements for the indicated protein constructs of Orai. Monensin, a Na+ ionophore, was added after 990 seconds to render all vesicles permeable to Na+ and establish a minimum fluorescence baseline. Fluorescence was normalized by dividing by the initial value. (C) Fluorescence trace observed for V174A Oraicryst in the absence and presence of Gd3+.
Fig. 2
Fig. 2
Architecture of Orai. (A) A ribbon representation showing the tertiary structure of the channel from the side. The helices are colored: M1 (blue), M2 (red), M3 (green), M4 (brown), M4 extension (yellow in subunit A and grey in subunit B). Also shown are a Ca2+ ion (magenta sphere) and the nearby Glu 178 residues (yellow sticks). Based on the hydrophobic region of the channel's surface, horizontal lines (~ 30 Å apart) suggest approximate boundaries of the inner (In) and outer (Out) leaflets of the membrane. (B) An orthogonal view of the channel from the extracellular side. (C) Close-up view showing the interaction between the M4 extension helices.
Fig. 3
Fig. 3
Ion pore. (A) Two M1 helices are drawn (four are omitted for clarity), showing the amino acids lining the pore in yellow. The approximate boundaries of the membrane-spanning region are shown as horizontal lines. In parentheses are the corresponding amino acids in human Orai1. Ser 161, Ser 162, Thr 164, Ser 165, Ser 169 and Gly 170 are drawn as grey sticks. (B) View of the pore. Within a ribbon representation of four M1 helices (two in the foreground are removed for clarity) is a representation (teal color) of the minimal radial distance from the center to the nearest van der Waals protein contact. The sections of the pore discussed in the text are labeled. (C) and (D) Molecular surface of Orai viewed from the extracellular (C) and intracellular (D) sides and colored according to the electrostatic potential contoured from -10 kT (red) to +10 kT (blue) (dielectric constant: 80).
Fig. 4
Fig. 4
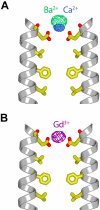
Cation binding in the external site. (A) Ba2+ and Ca2+ binding. The glutamate ring and hydrophobic section of the pore are depicted as in Fig. 3A. Anomalous difference electron density for Ba2+ is shown in green mesh (calculated from 20 – 5 Å resolution using phases derived from the final model and contoured at 6 σ from a diffraction dataset collected using λ = 1.70 Å X-rays and a crystal soaked in 50 mM BaCl2). Electron density corresponding to Ca2+ is shown from a simulated annealing Fo-Fc omit map (blue mesh, calculated from 20 – 3.8 Å resolution and contoured at 4 σ) from a crystal soaked in 50 mM CaCl2 (Table S1). The backbone carbonyl oxygen of Glu 178 is also shown in stick representation. (B) Gd3+ binding. Anomalous difference electron density is shown in purple mesh from a crystal soaked in 1 mM GdCl3 (calculated from 20 – 5 Å resolution using model phases and contoured at 11 σ from a diffraction dataset collected using λ = 1.70 Å X-rays).
Fig. 5
Fig. 5
Anion binding and the K163W mutant. (A) Anomalous difference electron density in the basic region of the wild-type pore contoured at 7 σ (orange mesh) and 14 σ (blue mesh) from a native un-soaked crystal. The M1 helices are depicted as in Fig 3A. The map was calculated using phases derived from the protein model and a diffraction dataset collected using λ = 1.735 Å X-rays (resolution range 20 – 5 Å, Table 1). (B) Anomalous difference electron density present in the wild-type pore from a crystal soaked in (IrCl6)3-. The map is contoured at 7 σ (green mesh) and 20 σ (red mesh) (calculated using model phases from 20 - 5 Å resolution from a diffraction dataset collected using λ = 1.1033 Å X-rays). (C) and (D) The K163W mutant. Two M1 helices of the K163W mutant are depicted in the same manner as (A). (C) Electron density (blue mesh) is shown for the tryptophan side chains at residue 163 (represented as sticks). The density is from a simulated annealing Fo-Fc map in which the tryptophan side chains have been removed from the model (calculated from 20 to 3.35 Å resolution and contoured at 3 σ). (D) Anomalous difference electron density (green mesh) in the pore of a K163W mutant crystal soaked in (IrCl6)3- (calculated from 20 - 5 Å resolution using model phases and contoured at 7 σ from a diffraction dataset collected using λ = 1.1033 Å X-rays).
Fig. 6
Fig. 6
Observed structure and hypothetical open state. (A) Observed (apparently closed) structure of Orai. The view is from the side with the M1 helices drawn as blue ribbons and the other helices shown as cylinders (M2 colored red, M3 colored green, and M4 and M4 extension colored yellow). A Ca2+ ion in the external site is depicted as a magenta sphere; an anion in the basic region of the pore is depicted as a grey sphere. Approximate boundaries of the lipid membrane are shown as horizontal lines. (B) Hypothetical model of an open state. The pore is widened by the outward dilation of the M1 helices (blue arrow). A black arrow indicates that Ca2+ is able to move though the pore unobstructed. The intracellular ends of the M1 helices are hypothesized to interact with a cytosolic portion of STIM, as are the M4 extensions, which are modeled to protrude into the cytosol. The depiction of a cytosolic portion of STIM is meant to posit the hypothesis that it might bridge the cytosolic portions of the M1 helices and the M4/M4 extension helices and is not meant to imply a particular structure, oligomeric state, or stoichiometry with Orai.

Comment in

References

    1. Hogan PG, Lewis RS, Rao A. Molecular basis of calcium signaling in lymphocytes: STIM and ORAI. Annu. Rev. Immunol. 2010;28:491. doi:10.1146/annurev.immunol.021908.132550 Medline. - PMC - PubMed
    1. Roos J, et al. STIM1, an essential and conserved component of store-operated Ca2+ channel function. J. Cell Biol. 2005;169:435. doi:10.1083/icb.200502019 Medline. - PMC - PubMed
    1. Zhang SL, et al. STIM1 is a Ca2+ sensor that activates CRAC channels and migrates from the Ca2+ store to the plasma membrane. Nature. 2005;437:902. doi:10.1038/nature04147 Medline. - PMC - PubMed
    1. Liou J, et al. STIM is a Ca2+ sensor essential for Ca2+-store-depletion-triggered Ca2+ influx. Curr. Biol. 2005;15:1235. doi:10.1016/i.cub.2005.05.055 Medline. - PMC - PubMed
    1. Feske S, et al. A mutation in Orai1 causes immune deficiency by abrogating CRAC channel function. Nature. 2006;441:179. doi:10.1038/nature04702 Medline. - PubMed

Publication types